


A Lighthouse score of 92 can coexist with users waiting for eight seconds. The test may have been done on the home page, from a fast machine, without authentication or consent scripts. Customers use An older phone on the checkout page.
The reverse happens too. An average laboratory score can hide a correct experience for the majority of real traffic.
The audit must therefore answer four questions: what users live in, what layer is responsible for it, what risk does it create, and what correction offers the best performance without weakening the rest?
1. Reference figures in 2026
Google considers the following values for Core Web Vitals as "good": Largest Contentful Paint less than or equal to 2.5 seconds, Interaction to Next Paint less than or equal to 200 milliseconds, and Cumulative Layout Shift less or equal to 0.1. The evaluation is for the 75th percentile of the loads, separated notably between mobile and desktop.
These thresholds are not universal ALS. They provide a common language centered on loading, reactivity and stability. A critical path may require more; a complex internal application must also measure the completed tasks.
The Web Almanac 2025 of HTTP Archive observes a median home page of 2.86 MB on desktop and 2.56 MB on mobile. On mobile, the median had 632 KB of JavaScript and 911 KB of images. 98.1% of the pages analysed required at least one JavaScript file.
The weight increased. Between July 2015 and July 2025, the median mobile home page increased from about 845 Kb to 2,559 Kb in the series presented, or +202.8% per cent. Over a year, the moving median 2025 was still growing by 8.4% per cent.
The cost of JavaScript appears better in laboratory tests. HTTP Archive measures a median Total Blocking Time of 1,916 ms in 2025, compared with 1,209 ms in 2024, or +58%. At the 90th percentile, it exceeded 7.5 seconds. At the same time, 77% of the mobile pages in the sample obtained a good INP in field data. The divergence illustrates why terrain and laboratory are not interchangeable.
The weight does not explain everything, but the relationship exists. Of the internal mobile pages weighing less than 1 MB, 68% passed the three Core Web Vitals; beyond 5 MB, 42% passed them. Architecture, the CPU, the cache and the loading order remain decisive.
2. The initial evidence pack: frame the audit
Before scanning, the auditor identifies:
- route that generates income, transaction or obligation;
- volumes, devices, countries and networks;
- availability, latency and deployment targets;
- incidents, costs and blocked requests;
- architecture, environments and suppliers;
- compliance, safety and accessibility constraints;
- planned changes within twelve months.
The scope can cover frontend, backend, API, CMS, infrastructure, IC/CD, observability and dependencies. If some layers are excluded, the report says so. Diagnosing a frontend without API access limits the confidence on the cause.
Three to five routes serve as red threads: discovery, connection, search, purchase, customer space, publication or internal action. Each recommendation specifies which one it improves.
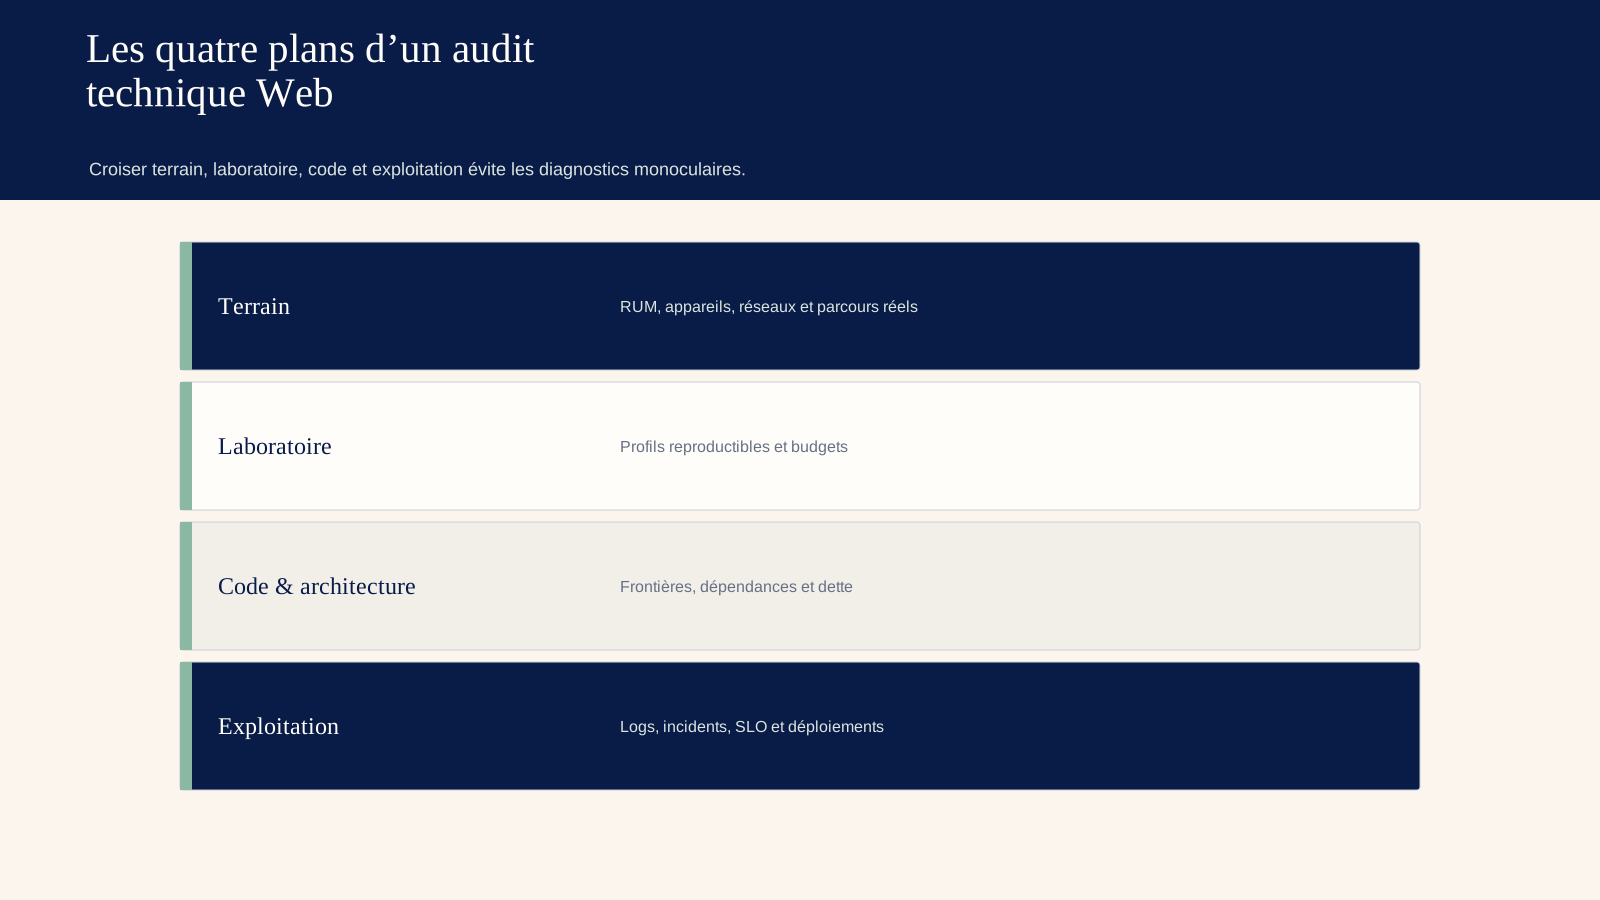
3. The four evidence layers
3.1. Field
The RUM and Chrome UX Report data show the actual experience: LCP, INP, CLS, errors, API latency, device, connection, page and version. They cover a population, but not always authenticated users or business events.
At least segment by mobile/desktop, country, template, browser, new/return and percentile. Average masks slow users. P75 aligns Core Web Vitals; p95 and p99 reveal important queues.
The terrain also measures the result: conversion, task completed, abandonment, error and support. A technical improvement without effect on the course may remain useful for resilience, but its benefit is different.
3.2. Lab testing
Lighthouse, WebPageTest, DevTools and profilers reproduce defined conditions. They provide waterfalls, main-thread traces, code coverage, memory data, cache information and captures. The auditor fixes the device, network, location, cache state and consent state.
Several repetitions are necessary. A single test can fall on a warm cache or a peak. The median and dispersion are kept.
The laboratory is used to isolate a cause and test a correction. It does not represent all the traffic.
3.3. Code and architecture
The review examines the module boundaries, rendering, state management, caching, calls, databases, queues and background jobs, errors, dependencies and security. It looks for mechanisms, not just symptoms.
A slow API can come from a N+1 query, an absent index, a sequential call or a third-party dependency. Adding a cache can mask the default and create an inconsistency. L的audit compares the options.
3.4. Operations
Pipelines, environments, versions, rollbacks, backups, alerts, incidents, costs and responsibilities determine reliability. A clean code without tested restoration remains risky.
The auditor follows a release and a recent incident. They measure lead time, failure rate, detection time and recovery time and observe the manual steps and privileged accesses.
4. Front-end performance: budgets by journey
The budget does not only set an overall weight, it focuses on the resources and the work of the browser.
Example for a mobile service page:
| Resource | Initial budget |
|---|---|
| Compressed HTML | 40 Kb |
| Critical and delayed CSS | 100 Kb |
| Initial JavaScript | 250 Kb |
| LCP image | 180 Kb |
| fonts | 120 Kb |
| third party prior to interaction | 100 Kb |
| initial requests | 45 |
| long tasks > 50 ms | defined threshold |
These values are illustrative. The budget comes from the target device and the value. A 3D application will have a different profile, but it must always explain the cost.
4.1. Diagnosing the LCP
The LCP breaks down in time until the first byte, discovery time, resource loading and rendering time. Optimising the image is not enough if it is discovered after a script or if the server responds in two seconds.
The audit checks for preloading, priority, format, dimensions, responsive images, CDN, cache and rendering. It identifies the LCP element by template, as a cookie banner can sometimes change the measurement.
4.2. Diagnosis of INP
The INP observes the latency of the interactions. The audit profiles the slowest input: waiting before execution, processing and presentation. Causes include long tasks, hydration, massive rendering, third-party earphones and synchronous calculation.
The correction can cut the work, report, virtualize, use a worker, simplify the status or reduce JavaScript. Adding a spinner does not necessarily reduce the actual latency.
4.3. Diagnosis of CLS
The CLS comes from content without dimensions, fonts, advertisements, injected components or layout animations. The auditor reproduces the issue with a cold cache and dynamic states. The remediation reserves space and uses appropriate transformations.
A stable page at loading can move after consent or customization. Scenarios cover these states.
5. JavaScript: download cost and execution cost
HTTP Archive talks about "double tax": the code is downloaded and executed. One hundred kilobytes of a single library is not worth a hundred kilobytes of a script that scans the DOM and blocks the main thread.
The audit builds a bundle map: road, module, owner, compressed size, coverage, CPU time and execution time. It searches for duplicate libraries, unnecessary polyfills, heavy dependencies and loaded code before need.
Third party scripts receive a record: purpose, owner, consent, weight, CPU, data, availability and deletion plan. A widget without owner is a liability.
The server-side or static rendering can improve discovery and first display. It adds cache, invalidation and hydration. The audit does not recommend a mode; it compares needs by road.
6. Back end and APIs: measure every boundary
Total latency is broken down: DNS, connection, edge, application, base, cache and third party. Distributed tracks link the query.
The audit examines:
- time p50/p95/p99 per endpoint;
- error rate and timeouts;
- base requests and execution plans;
- sequential or redundant calls;
- caches, keys, TTL and invalidation;
- idepulence and retrieving;
- pagination and limits;
- queues, jobs and poison messages;
- spleen limits and circuit breakers;
- serialization and payload size.
Load tests are gradually increasing, identifying the saturation point and degraded behaviour. They are performed in production only with permission, protection and window.
An endpoint that quickly responds to ten users can collapse to 200 due to a pool of connections. Capacity must be linked to the expected peak and margin.
7. Architecture: boundaries, dependencies and change
The diagram C4 or equivalent shows users, systems, containers, components and flows. The audit looks for couplings that make a small modification dangerous.
A monolith is not a debt by nature. It can be simple to deploy and coherent. Microservices can multiply networks, data, operations and incidents. The question is: do borders correspond to teams and rhythms of change?
The ADRs — architectural decisions — explain the choices and alternatives. Their absence does not make the system bad, but complicates the transmission. The audit documents the most structuring decisions.
Reversibility covers data, content, identities, files, DNS, CDN and services. A proprietary dependency is evaluated on the basis of output cost, not abstract principle.
8. Technical debt: build an economic impact register
Debt is a choice or inheritance that increases the cost, risk or future delay. TODO.
Each debt receives:
- symptom and cause;
- affected route;
- probability and impact;
- recurring cost;
- correction option;
- dependencies;
- proof of closure.
Logiks distinguishes code debt, architecture, data, infrastructure, security, testing, observability and knowledge. Absent documentation can be more risky than a duplication of twenty lines.
The priority combines interest paid and risk. A debt that adds two days to each monthly release costs 24 days a year. An exposed vulnerable library may require immediate correction even without visible recurring costs.
The register also contains accepted debts. Rewrite a stable component at the end of life produces little value. The audit must be able to recommend not to intervene.
9. Security: integrated screening
A technical web audit includes a surface examination, without replacing a penetration test when necessary.
It checks authentication, sessions, authorizations, secrets, dependencies, headers, upload, injection, SSRF, XSS, CSRF, logging and exposure of environments. Controls align with context and the OWASP Application Security Standard Verification or adapted repositories.
Vulnerabilities are confirmed with caution. A scanner can produce false positives. No destructive test is run without permission.
Dependencies are sorted by exploitability, exposure and actual use. Updating any blindness can break the product; ignoring a exposed critical CVE is worse.
The deployment chain is included: branch protection, CI secrets, artifacts, provenance, cloud accounts and agency access.
10. Accessibility and performance intersect
An interface made only after JavaScript can hinder assistive technologies and search engines. Heavy animations affect reactivity and movement preferences. A focus lost after a dynamic rendering is a functional debt.
The screening tests keyboard, focus, accessible names, structure, zoom, form errors and contrasts. A complete RGAA audit requires a specific methodology and wider manual tests.
The WebAIM Million 2026 detected 56,114,377 errors on a million home pages, or 56.1 per page on average, +10.1% over a year. The study states that automatic tools do not detect all failures and that the absence of error does not prove compliance. This reserve must accompany any automatic score.
11. Observability and resilience
SLOs cover availability, latency, error rate and route completed. An error budget defines the allowed margin of default. When the budget is consumed, reliability becomes a priority.
Alerts are based on impact: increased payment failures, blocked file, p95 exceeded, certificate near expiry. An isolated CPU alert can be diagnostic, not emergency.
The audit simulates or examines: third-party API failure, unavailable base, empty cache, traffic peak, rollback and restoration. The degraded mode must preserve important functions.
Backups are useful if a restore is tested. The key measure is real time and data loss, compared to expected RTO and RPO.
12. Practical case: quick checkout in lab, slow for customers
An e-commerce gets 89 on Lighthouse for its checkout. However, mobile conversions decline after a redesign.
Field data shows an INP p75 of 420 ms on mid-range Android. The standard lab had not triggered the payment widget, the CMP and the chat. Together, they add 480 KB of JavaScript and two long tasks after the first click.
The trace also reveals that each strike in the address recalculates the entire basket. The team separates the state, loads the cat after request, rejects a marketing tag and replaces the widget with a lighter integration on the devices concerned.
The budget imposes 250 Kb of initial JavaScript on the checkout and no third-party task more than 100 ms before payment. A synthetic test and RUM monitoring for each release tracks regressions.
After four weeks, the INP p75 passes within 200 ms on the segment, errors remain stable and conversion is compared to a control cohort. The audit does not automatically attribute all gain to speed; it measures.
13. Scoring and prioritisation
The audit assigns separate scores: field experience, frontend, backend, architecture, security, exploitability, debt and accessibility. Each score has proof and level of confidence.
Recommendations are classified as follows:
- P0, critical risk or imminent unavailability;
- P1, essential route, high safety or high cost;
- P2, measurable gain in the quarter;
- P3, structural improvement or opportunity.
An effort–impact matrix is not enough. The sequence considers dependencies and risks of change. An update of the framework may be necessary before optimising, or the reverse.
Each ticket contains metrics before, target, test method and rollback. "Optimising images" becomes "reducing mobile LCP image from 620 to less than 180 Kb, maintaining validated quality and measuring LCP p75 by template".
14. Deliverables expected
- executive synthesis with risks and decisions;
- route map and field metrics;
- laboratory record of traces;
- diagram of architecture and dependencies;
- frontend, backend, data and IC/CD analysis;
- Numbered debt register;
- security screening and accessibility;
- performance budgets and OLS;
- prioritised backlog with acceptance criteria;
- Plan 48 hours, 30 days, 90 days, 12 months.
The test files, queries and configurations are submitted where possible. The audit must be reproducible.
15. Frequently Asked Questions
15.1. Is Lighthouse enough?
No. It is a useful laboratory tool. It must be completed with field data, authenticated path, backend traces, architecture and operation.
15.2. Should an old product be rewritten?
Rarely on the basis of age alone. Compare incremental modernization, module extraction, replacement and maintenance. Rewriting loses business rules and creates a period of double risk.
15.3. How long does the audit last?
Two to six weeks for an average application. Load testing, in-depth security work or a distributed architecture can extend the scope.
15.4. Can issues be fixed during the audit?
P0s can be processed immediately with agreement. To preserve the independence of the diagnosis, the changes are plotted and the measurements before/after retained.
15.5. How often do you audit?
After major overhaul or change, then annually for a critical product. RUM, CI tests, dependencies and SLO monitor between audits.
16. What mobile lab testing can establish about caching and Core Web Vitals
The laboratory reproduces a scenario; the field measures a real population. The diagnosis brings the two together. A regression visible in the RUM is reproduced with a comparable device, network, cache, geography and connection state.
The fixed protocol URL, path, number of execution, median and dispersion. It distinguishes first visit, return, authenticated user and hot cache. Traces keep waterfall, main thread, images, fonts, third party scripts and layout changes.
Before concluding that a bundle is responsible, the team disables the resource in a controlled environment, measures the effect several times, checks the lost features and searches for interaction with server, CDN or third party tag; this avoids turning a profiling correlation into certainty, then funding a rewriting that does not change the experience at the 75th percentile.
Release validation combines a budget per template with a CI guardrail on controlled resources. After deployment, a cohort checks LCP, INP, CLS, errors, and conversion. The patch is closed only after sufficient field observation.
The diagnostic traces, versions and test conditions remain attached to the ticket. A future regression can thus be compared on an identical basis, without confusing evolution of the site, network, browser or protocol.
17. What Logiks recommends
First measure real user journeys and the percentiles, then use the laboratory to isolate the causes. Connect each debt to a cost or risk, impose budgets by road and test restoration as a rollback. The best audit does not maximize the number of defects found: it reduces uncertainty on the next technical decisions.
18. Main sources
- Google web.dev, Web Vitals Core Web Vitals: https://web.dev/articles/vitals
- HTTP Archive, Web Almanac 2025 — Page Weight : https://almanac.httparchive.org/en/2025/page-weight
- HTTP Archive, Web Almanac 2025 — Performance : https://almanac.httparchive.org/en/2025/performance
- WebAIM, The WebAIM Million 2026 : https://webaim.org/projects/million/
- OWASP, Application Security Verification Standard : https://owasp.org/www-project-application-security-verification-standard/