


A company can have a new site, a CRM, an ERP, fifteen SaaS tools and remain digitally fragmented in its operation. The estimates are retrieved. Leads are lost between marketing and business. Customers call to know the status of an order. The numbers arrive after the decision.
The problem is not the lack of technology. It is discontinuity.
The strategic audit looks at where information, decision-making and experience break down, distinguishing between assets to be reinforced, debt to be absorbed and investments that would add only an extra layer.
1. Key figures: digital adoption is advancing, but integration remains a challenge
Eurostat reports that in 2024 73% of SMEs in the European Union reached at least a basic level of digital intensity, compared with 98% of large enterprises, but only 6% of SMEs reached a very high level, compared with 41% of large enterprises. 27% of SMEs remained at very low levels.
The EU 2030 target foresees that more than 90% of SMEs reach at least the basic level. This threshold itself corresponds to the use of at least four of the twelve technologies. It measures a presence, not necessarily an integration or a value.
In 2025, 53% of European companies used at least one ERP, CRM or business intelligence tool. 46.45% used an ERP, 28.51% used a CRM and 16.28% used the BI. The gap between small and large companies was 58 points for the BI, about 11% compared to 69%.
In France, the Barometer France Num 2025 reports that 84% of the TPE-SMEs surveyed have at least one online visibility solution and 65% a site with their business. 40% believe that digital is increasing their turnover and 35% their profits. These perceptions are positive, but they do not replace the measurement of a specific channel or process.
The same barometer indicates that 37% of SMEs offer sale or payment online, 27% offer a sales solution and 26% offer a payment solution. It also notes that more than one third have faced a cyber threat. The digital strategy must therefore bring value and resilience.
Finally, the Almanac 2025 Web has a median home page of 2.86 MB on desktop and 2.56 MB on mobile, increasing annually. The median mobile page had 632 KB of JavaScript and 911 KB of images. A new digital asset can degrade the experience if it accumulates marketing, widgets and media scripts without performance budget.
2. Digital strategy assessment
The audit produces a balance sheet consisting of five columns.
| Category | What we measure | Example |
|---|---|---|
| Assets | Reusable and possessed capabilities | brand, data, audience, API, content |
| Flow | paths that create the value | acquire, sell, deliver, serve, loyalty |
| Frictions | losses, expectations, seizures, errors | manual estimate, identity breakdown |
| Dependencies | suppliers, skills, components | SaaS critique, single agency, closed format |
| Options | investments and experiments | client portal, automation, redesign |
This structure avoids two ways. The technical audit sees the systems without always seeing their economic effect. The marketing audit sees the channels without always seeing the data, the debt and the operations that support them.
An asset receives strategic value when it is usable, maintained, measured and difficult to replace. A thousand non-up-to-date items do not automatically constitute an asset. A repository of own knowledge, with a qualified audience and clear rights, yes.
3. The seven flows to be followed from end to end
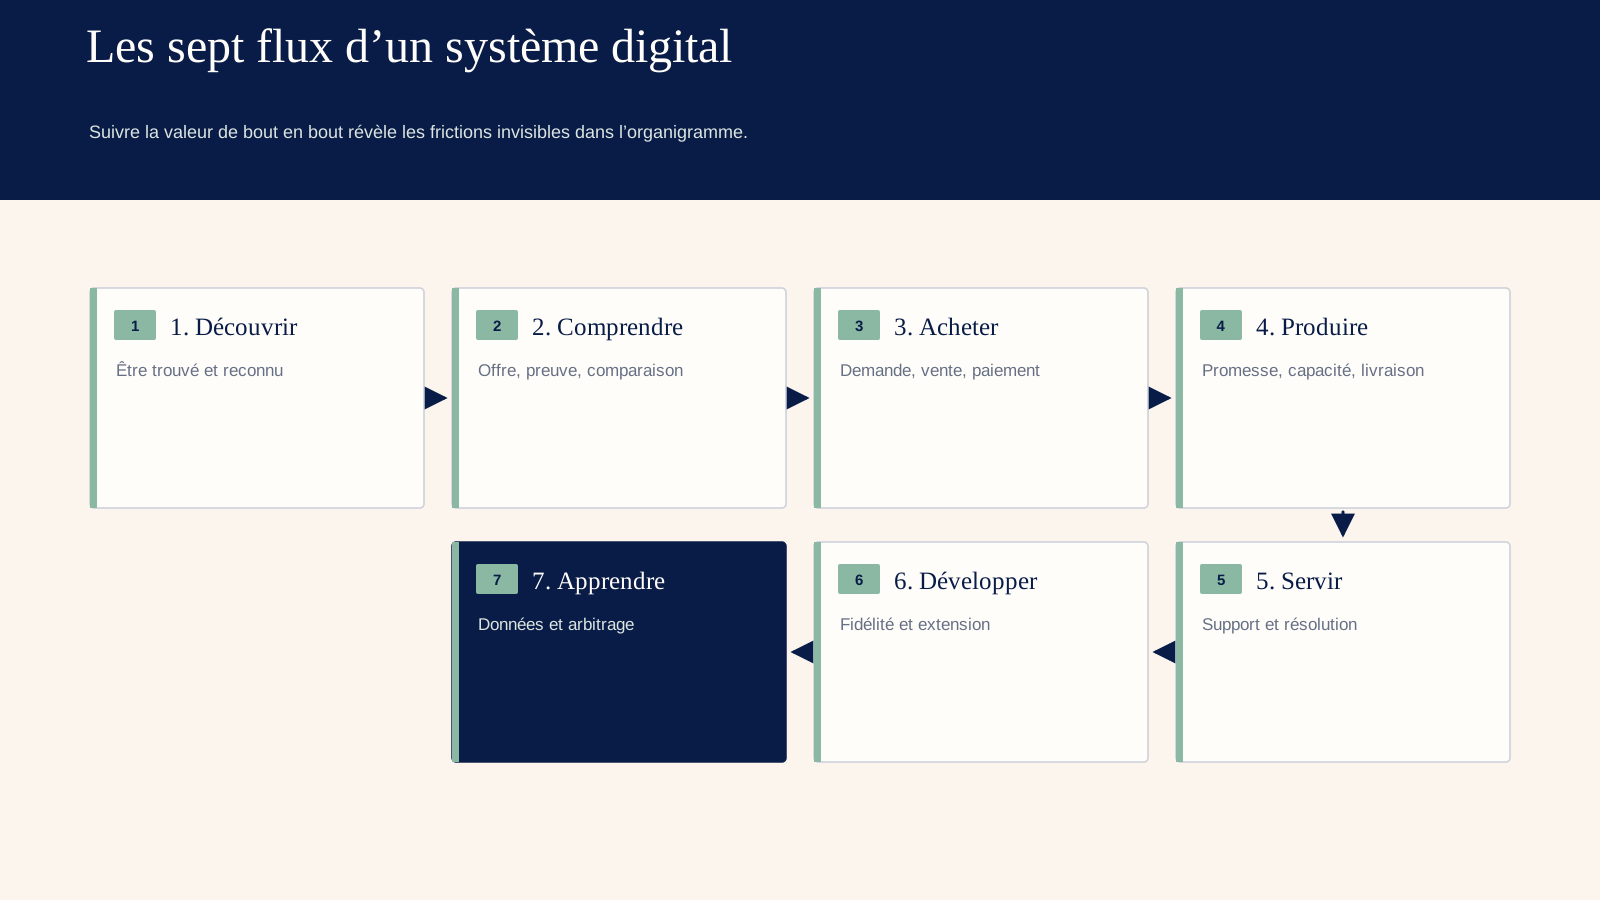
3.1. Get discovered
The audit examines how prospects find the company: traditional research, Ai responses, networks, recommendations, platforms and direct access. It measures part of brand demand, visibility on intentions, skilled traffic, pay dependency and consistency of information.
It does not stop at the volume. A page can generate traffic without leading to an application. A mark can be cited by an engine without receiving a click. Sources and conversion are linked.
Evidence: Search Console, analytics, queries, quotes, backlinks, campaigns, notoriety studies and content.
3.2. Understand the offer
The prospect must identify problem solved, target, proof, price or method of purchase. The audit performs comprehension tests in five seconds, interviews and analysis of service pages.
It compares brand promise, commercial discourse and operational reality. A different proposal on each channel increases the cost of explanation.
Evidence: user testing, consent recordings, commercial issues, rate of progression and objections.
3.3. Buy or enquire
The flow covers form, quote, payment, contract and transmission to CRM. Each field, validation, waiting and reselection is observed. The conversion rate is segmented by channel, device, profile and offer.
A short form is not always better. It must collect what serves the next decision. The audit mainly searches for the fields without use and the information requested several times.
Evidence: tracking plan, CRM, billing, route testing, delays and reasons for abandonment.
3.4. Produce and deliver
A digital sale that triggers ten manual manipulations moves friction. The audit follows the order in ERP, planning, stock, production and partner. It measures lead time, recovery rate, errors and visibility.
The data must travel with the object. A common identifier avoids manual searching. Exceptions are mapped as they often absorb the majority of the time.
Evidence: logs, sample records, time per stage, tickets and reconciliations.
3.5. Serve and support
The client is looking for an answer, status, document or resolution. L-audit compares self-service, human support and escalation. It does not seek to divert contacts at any cost: an incorrect automatic response increases repetition.
The content, rights and data required for the support are evaluated. The resolution rate at the first contact, response time and reopenings are more useful than the number of tickets closed.
Evidence: knowledge base, tickets, verbatims, timelines, satisfaction and repetitions.
3.6. Retain and grow
The flow links additional usage, satisfaction, renewal, recommendation and sales. The audit checks whether the signals arrive before the customer leaves and whether an action exists.
Campaigns should not replace experience. A loyalty programme that distributes discounts to already acquired customers can destroy margin without changing behaviour.
Evidence: cohorts, retention, frequency, margin, grounds for termination, NPS accompanied by verbatims and experiments.
3.7. Manage and learn
Do the decisions have metrics, a source, a frequency and a owner? Are the tests stored? Do the teams learn from an incident?
The audit compares the time between event and decision. A table to J+30 does not drive a daily campaign. Instant but unreconciled data can mislead.
Evidence: steering meetings, dictionary, dashboards, backlog experiences, decisions and results.
4. The twelve assets to assess
The audit does not value intangible assets on an accounting basis; their strategic usefulness is assessed in the decisions they allow.
- Mark. recognition, distinctive assets, reputation and right of use.
- Direct audience. consented subscribers, customers, brand traffic and communities.
- Contents. cover of intentions, quality, freshness, sources and rights.
- Customer data. identity, quality, consent, history and activation.
- Operational data. products, stocks, timelines, costs and incidents.
- Software. products, APIs, components, code and documentation.
- Automation. flows, rules, controls and recovery capacity.
- Models and evaluations. Ai, scores, test games and knowledge.
- Integrations. Identifiers and contracts between systems.
- Competences. people able to exploit, decide and restore.
- Process. Reproducible methods, thresholds and exception management.
- Partner relations. access, contracts, channels and output capacity.
Each asset is rated according to property, quality, adoption, differentiation, security and reversibility. A subscribed but not integrated software gets a low value. An API documented and used by five products has a strong value.
5. Mapping frictions with their cost
Friction is a valueless effort for the customer or the company. It can be visible — blocked form — or internal — manual reconciliation.
The audit collects five units: minutes, errors, abandonments, euros and risk. Example: retrieving a quote takes twelve minutes, concerns 800 files per month, produces 3% errors and delays sending by four hours.
Annual cost of time = 12 minutes × 800 × 12 / 60 = 1,920 hours, before errors and opportunities. This estimate does not claim that every hour will be saved. It dimensiones the issue.
Friction points are classified:
- customer, effort, expectation, uncertainty;
- employee, search, input, double control;
- information, absent or contradictory data;
- system, slowness, breakdown, integration;
- Decision, late metric or blurred liability;
- Risk, excessive access, dependence, non-compliance.
The same cause can cross several streams. The absence of customer ID produces duplicate marketing, unhistorical tickets and a false margin. Correcting the repository is better than three local projects.
6. Review the architecture without conducting a full technical audit
The strategic audit seeks the properties that limit the roadmap: modularity, security, availability, data, integration, cost and reversibility.
It maps reference systems, exchanges, identities, suppliers, volumes and timelines. It identifies critical manual files, shared keys, obsolete versions and components without owner.
A thorough technical audit can be recommended if the evidence is insufficient. The strategy does not claim to measure the quality of the code in a few interviews. It identifies the business impact of the debt and the decisions to be investigated.
Example: an old CMS blocks weekly deployment, degrades performance and makes each new language expensive. The report does not automatically conclude "recast". It compares modernization, decoupling, migration and maintenance, with cost and risk.
7. Assessing digital dependency
Each critical supplier receives a concentration test.
- share of income or dependent process;
- exportable data and configurations;
- replacement time;
- internal competencies;
- contractual options;
- admin access;
- price history and availability;
- gradient mode.
Dependence is not necessarily bad. Using a specialized provider can be rational. The risk comes from the lack of choice and knowledge.
The Data Act, which has been in force since September 2025, reinforces certain conditions for change between data processing services. This does not make an automatic migration. The company still has to document formats, interfaces, applications and tests.
8. Security and compliance as strategic constraints
More than one third of the microbusinesses and SMEs in the France Num Barometer 2025 report having encountered a cyber threat. CNIL received 6,167 notifications of violations in 2025, half of which involved hacking.
The audit verifies identity, backups, access, providers, logs, recovery and sensitive data on critical flows. It also examines consent, durations, rights and transfers. Variances are linked to the strategic impact: interruption, trust, regulatory penalties, loss of data or inability to sell to a demanding customer.
Digital must not increase the attack surface without operational capability. Each new portal or API has an owner, a service level and an incident procedure.
9. Prioritise: return, optionality and risk
Each investment receives four marks.
Expected value. revenue, margin, cost, lead time, experience or resilience.
Proof. data quality, observation, benchmarking, testing or intuition.
Total effort. construction, migration, change, operations and induced debt.
Option created. Reusable components and assets for the following projects.
The score does not replace the committee. It reveals the assumptions. A project with high value but low proof becomes experience. A regulatory project may be a priority without direct ROI. A project creating common identity can unlock five streams.
The roadmap balances three horizons:
- 0–90 days, remove blockages and measure;
- 3–12 months, build common assets and integrate;
- 12–24 monthstransform operational products and models.
Each initiative has an exit criterion. If the pilot does not reduce the deadline by 20% or does not meet the expected adoption rate, the committee shall adapt or stop.
10. Practical case: growth blocked by back office
A service company wants to double its leads. Its website converts adequately, but the average quote turnaround is four days. 22% of prospects follow up before receiving a quote. The sales team copies form data into a spreadsheet, then into the CRM and billing system.
The audit shows that the acquisition problem is not a priority. Each additional euro media feeds an already saturated queue.
The first investment creates a unique file: structured form, qualification, bid catalogue and quotation generation with validation. CRM becomes the source of the status. A portal displays the missing parts.
The target time is increased from four days to twenty-four hours. The project is piloted on a segment for six weeks. The indicators follow clear time, errors, acceptance and commercial satisfaction.
The redesign of the site is limited to pages that still promise the old deadline. The media budget increases only when capacity is proven. The audit has changed the order of investments, not just the list.
11. The audit process
The mission combines:
- senior management, business functions, customers and operations;
- analysis of data and documents;
- Key path testing on several devices;
- observation of actual records;
- mapping systems and suppliers;
- performance review, SEO, tracking, accessibility and security at a screening level;
- cost and prioritisation workshop;
- a challenge session with the owners.
Diagnosis does not add tool scores. It builds a chain of evidence between friction, cause, impact and recommendation.
12. Deliverables expected
- map of the seven flows and breaking moments;
- balance sheet of the twelve assets;
- inventory of critical systems and dependencies;
- Registry of frictions with cost and proof;
- priority risks and specialized audits required;
- portfolio of options and criteria go/stop;
- road map 90 days, 12 months, 24 months;
- governance model and indicators;
- decisions required of the Management Committee.
The annexes retain the observations. The summary is ten pages long and makes it possible to decide. A readout consisting only of 150 slides dilutes the priority.
13. Signs of a superficial audit
- identical recommendations for all companies;
- maturity note without evidence;
- inventory of non-flow tools;
- Proposed recast before measurement of friction;
- absence of clients and operations in interviews;
- ROI without cost of change or operation;
- cybersecurity relegated to annex;
- no recommendation for cessation;
- road map without owner or threshold;
- confusion between technological adoption and value.
An independent audit must be able to conclude that an investment is not necessary. Otherwise, it looks like a commercial phase for a solution already chosen.
14. Frequently Asked Questions
14.1. What is the difference with a technical audit?
The strategic audit considers flows, assets, dependencies and investments. The technical audit examines in depth code, architecture, performance, security and usability. The first can trigger the second.
14.2. How long does it take?
Four to ten weeks depending on the entities and data. A simple SME can target three flows in one month. A multi-country group requires sampling and local workshops.
14.3. Should all tools be analysed?
No. Prioritise those who support critical flows and risks. Secondary tools are inventoried to detect duplicates, costs and sensitive data.
14.4. Should the audit include clients?
Yes when experience and growth are at stake. Five to ten well-targeted interviews reveal invisible frictions in analytics, without pretending to represent statistically the entire clientele.
14.5. How can execution be secured?
Transform each recommendation into a decision, owner, first step, indicative budget and proof. Install a monthly review of the roadmap and explicitly close the agreed initiatives.
15. How each item of evidence changes resource allocation
A strategic recommendation must change a decision. The report therefore links each piece of evidence to a choice: consolidate two sites, retire a tool, redesign a journey, make a dataset reliable or test a channel. Without an associated choice, a finding remains merely informative.
The portfolio is placed in a matrix of value, urgency, dependence and reversibility. Foundations that unlock several initiatives date back, even if their direct ROI is difficult to isolate. Commercial bets remain experimental until demand and economy pass the written thresholds.
Prior to the committee, the team listed three scenarios — not to change anything, to correct any existing ones, to replace — with migration, operation, training, risk and opportunity costs; it indicated the most sensitive assumptions, the missing data and the time when new evidence could reverse the ranking, so that the recommendation did not look like an artificially precise business case built to legitimize an already preferred solution.
The follow-up measures taken decisions, dependencies lifted, delays, budget gaps and results. A completed action without expected effect becomes a learning to reuse, not a success because the project has been delivered.
The ninety-day review repeats the three most important investments, compares the expected benefit with the first signals, checks the dependencies actually raised and reallocates resources if the hypothesis weakens; it keeps above all a trace of the initial reasoning, because a digital portfolio learns better when it can explain why an initiative has been accelerated, limited or stopped without turning every decision passed into retrospective evidence.
16. What Logiks recommends
Follow the seven streams before discussing the tools. Quantify the friction, value the reusable assets and test the dependency to each critical supplier. Then finance the options that solve a common cause and have a shutdown criterion. A digital strategy is a decision order, not a catalogue of projects.
17. Main sources
- Eurostat, Digitalisation in Europe — 2025 edition : https://ec.europa.eu/eurostat/web/interactive-publications/digitalisation-2025
- Eurostat, ERP, CRM and BI in enterprises in 2025: https://ec.europa.eu/eurostat/web/products-eurostat-news/w/ddn-20260520-1
- France Num, Barometer France Num 2025 : https://www.francenum.gouv.fr/guides-et-conseils/strategie-numerique/comprendre-le-numerique/barometre-france-num-2025-le
- HTTP Archive, Web Almanac 2025 — Page Weight : https://almanac.httparchive.org/en/2025/page-weight
- CNIL, Annual Report 2025 : https://cnil.fr/fr/rapport-annuel-2025
- European Commission, Data Act explained : https://digital-strategy.ec.europa.eu/en/factpages/data-act-explained