


Management asks for the revenue for the month. Finance reports 4.8 million euros. CRM displays 5.1. The sales dashboard shows 5.4. All three figures can be correct: billed versus signed, accounting currency versus contract currency, cancellations deducted on different dates.
The problem is not the lack of data. It is the absence of a system that preserves meaning from end to end.
This discipline builds the system. It links applications, makes transformations reproducible, detects anomalies and publishes data with a definition. Its work is invisible when everything works. It suddenly becomes strategic when results diverge or a source changes without warning.
1. Key figures: widespread software, but far less data is actually used
Eurostat reports that in 2025, 53% of European Union enterprises with at least ten employees used at least one specialised ERP, CRM or business intelligence application. In detail, 46.45% used an ERP, 28.51% used a CRM and only 16.28% used a BI tool.
The size gap remains considerable. The use of an ERP ranged from 41% in small businesses to 89% in large businesses. For BI, it increased from 11% to 69%, or a 58-percentage-point gap. Accumulating transactional applications therefore does not guarantee a consistent ability to analyse what they produce.
Another Eurostat publication shows that 33.02% of enterprises carried out data analyses with their own employees in 2025 and 13.85% entrusted them to an external provider. By combining the two approaches without double counting, 39.85% performed a form of analysis. In other words, a majority of the sampled companies still did not report this practice.
On a very large scale, Google describes a validation system used by hundreds of product teams to monitor several petabytes of production data per day. The volume is specific to Google, but the lesson applies elsewhere: a pipeline can continue to work technically while ingesting an unexpected schema, implausible value or a drifting distribution.
The same research group proposed a "ML Test Score" with 28 tests and monitoring needs to reduce technical debt in machine-learning systems. This framework shows that model performance covers only a small part of the reliability. Data, code, infrastructure and monitoring must be tested together.
2. The data-product passport
A table is not yet a product. To become usable, it needs a passport that business and technical teams can understand.
| Field | Example: “net revenue” |
|---|---|
| Decision supported | monthly management reporting and cash-flow forecasting |
| Business owner | finance department |
| Technical producer | data platform team |
| Definition | invoices issued, excluding tax and net of credit notes |
| Grain | one line per invoice and accounting currency |
| Sources | ERP, customer repository, exchange rate |
| Freshness | available at D+1 before 7 a.m. |
| Quality | completeness > 99.5%; currency populated for 100% of records |
| Access | finance and executive management; aggregates for the sales team |
| History | corrections retained with effective date |
| SLA | recovery within four hours |
| Contact | defined support channel and on-call rota |
This passport avoids two sterile conversations. Business teams no longer request "all data in real-time" without explaining the decision. Engineers no longer publish a columnrevenue_v2_finalwithout a shared definition.
The business owner decides the meaning and authorised uses. The technical producer guarantees the agreed service and quality levels. These responsibilities are complementary.
3. A data item’s journey in nine stages
Follow an order from an e-commerce site to the margin table.
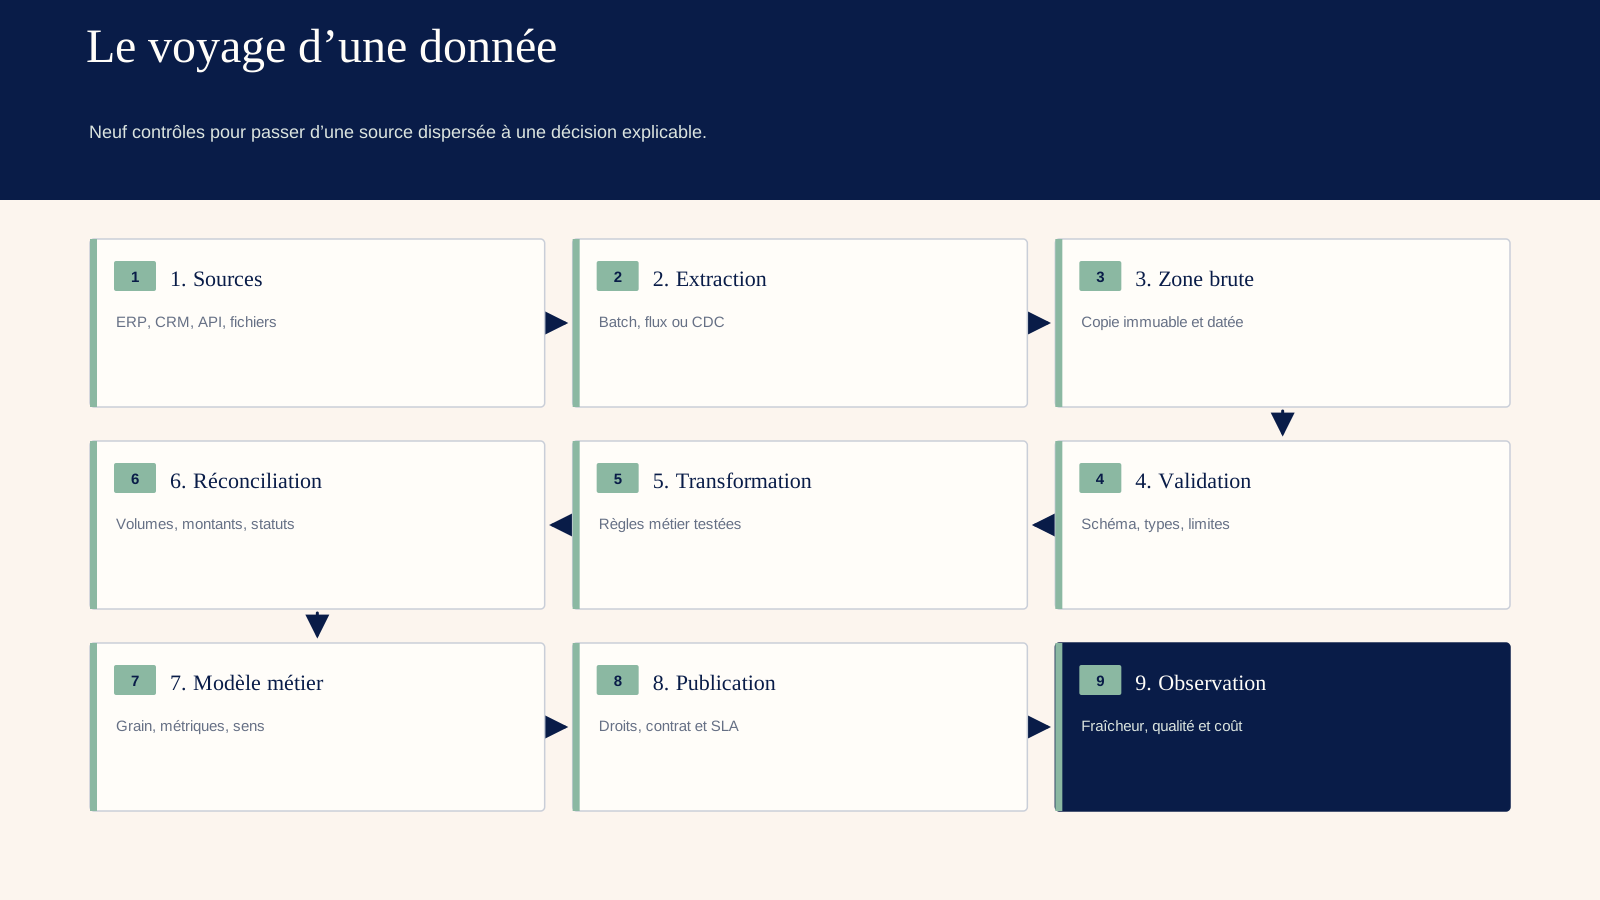
3.1. Creation in the source system
The order originates in the transactional application. This system optimises sales, not historical analysis. A status change may overwrite the old value; a refund may arrive several weeks later.
The data team documents fields, events and identifiers. It avoids direct access to a production database without a data contract, as an analytical query may hinder the service or depend on an internal schema.
3.2. Extraction
Three methods dominate: periodic export, API and change capture. Periodic export is simple but less timely. The API complies with the product rules but may be limited. Change data capture quickly replicates inserts and updates, at the cost of a more demanding architecture.
The choice depends on the need. Daily reporting does not need a millisecond-latency event stream. An anti-fraud system can justify it.
3.3. Raw zone
Data is retained in its original form, timestamped and immutable. The raw zone allows a process to be rerun after correction. It should not become an unlimited dump: encryption, access, catalogue and retention rules apply as soon as ingestion takes place.
The source, the version of the schema and the batch are recorded. Without these metadata, rollback remains theoretical.
3.4. Ingestion validation
The pipeline checks the basic rules: expected columns, types, unique identifiers, plausible dates, non-negative amounts and known references. A critical anomaly quarantines the batch. A tolerated anomaly is counted and reported.
Do not "clean" silently. Replacing a missing currency with EUR may produce a false margin. The correction is documented or returned to the source system.
3.5. Transformation
Raw records are transformed into stable entities: order, customer, product, payment. The exchange, cancellation and allocation rules are versioned as code. The tests cover known cases.
A transformation must be idempotent: rerunning the same batch produces the same result. This property simplifies recovery after an incident.
3.6. Reconciliation
The pipeline compares the totals between steps. Order counts, total amounts and distribution by status must be explained. A difference of 2% is not masked by an average.
Reconciliation with the financial source remains indispensable. The data warehouse does not become the source of truth merely because it is modern.
3.7. Business modelling
Tables are organised around decisions: net sales, margin, retention, available inventory. The semantic model defines the metrics once and then exposes them to the dashboards and analyses.
The grain is explicit. Adding an already aggregated value at the client level in a table at order level creates subtle duplication. A good model makes such errors harder.
3.8. Publication
The data product is published in the catalogue with its passport, rights and level of service. Consumers are notified of changes. A major version may coexist during a migration period.
Self-service does not mean universal access. It means that authorised users can find, understand and use the data without raising a manual ticket.
3.9. Monitoring
The platform monitors freshness, volume, schema, values, distribution, lineage and consumption. It links an alert to its impacts: which dashboards, models or decisions depend on the table?
A green pipeline that delivers zero rows remains an incident. Technical observability and business quality complement each other.
4. Batch, micro-batch or real time: choose by the cost of delay
"Real time" is often a preference expressed before the need is calculated. Logiks proposes a more useful question: what is the cost of data arriving five minutes, one hour or one day late?
Batch processing runs on a schedule. It is suitable for financial reporting, consolidated billing and analysis with daily or monthly decision-making cycles. It is easier to replay, test and audit.
Micro-batching runs small batches every few minutes. It offers a compromise for sales management, inventory or selected alerts.
Streaming processes events when they arrive. It is suitable for fraud, immediate personalisation, critical sensors or operations where a lost minute actually costs. It introduces event ordering, duplicate handling, late-arrival management, replay, distributed state and continuous monitoring.
To choose, four costs are compared: the cost of delay, build cost and operating cost, and the cost of an erroneous decision. Instant but unreconciled data may be less useful than a reliable batch at D+1.
5. Data contracts: making change manageable
A contract describes what a producer promises to its consumers: schema, meaning, freshness, quality, availability, classification and change rules. It can be represented in a versioned file that is validated automatically.
Example: the fieldcustomer_idis non-null, stable and pseudonymised;amount_htis expressed in cents incurrency; a cancelled order keeps its history; the table is complete at 6:30 a.m.
When a producer wants to rename a field, the tests identify consumers. The change requires a version and a migration window. The contract does not block evolution; it prevents surprises.
There is a limit. A contract does not correct unclear accountability. If no one has the definition of the active client, the best-documented schema will not resolve the issue.
6. Quality: measure against the intended use
Quality is not a universal score. It is assessed across dimensions.
Completeness. Are the required values and lines present?
Accuracy. Do they correspond to the actual phenomenon or the reference source?
Uniqueness. Is an object counted only once?
Consistency. Are the rules between fields and systems respected?
Timeliness. Do the data arrive before the decision?
Validity. Do they respect the expected format and domain?
Traceability. Can one explain their origin and transformations?
Thresholds come from impact. A missing address in a marketing list does not have the same cost as an absent IBAN before payment. The response is also defined: blocking, isolating, degrading, warning or accepting.
An overall score is misleading if it compensates for a critical dimension. A table can be "98%" while containing 20% of errors on the most profitable segment.
7. Architecture: warehouse, lake and lakehouse
A data warehouse strongly structures the information for analysis. It offers SQL, governance and predictable performance. A lake retains varied data at lower cost, but requires discipline to remain exploitable. The lakehouse seeks to combine open formats, transactions and analytical capabilities.
The choice is not a matter of fashion. It depends on existing formats, volumes, skills, AI needs, portability and tools. An SME with ten structured sources can succeed in a managed warehouse. Adding a distributed lake would increase operational burden without creating value.
Storage-compute separation improves elasticity and portability between engines. Open formats improve reversibility. But an open platform can still create lock-in if all transformations depend on a proprietary service.
The Data Act, applicable across the European Union since 12 September 2025, strengthens the framework for switching between data-processing services, including cloud and edge services. It requires contractual transparency, open interfaces for certain services and the complete removal of switching charges, including certain data-egress charges, from 12 January 2027. Architecture should support export before a move becomes urgent.
8. Observability: from alert to diagnosis
A useful alert contains the affected product, the broken rule, the gap, dependencies and the owner. “Job failed” provides too little context.
These include:
- pipeline success rate and duration;
- delay from SLA;
- abnormal volume variation;
- schema evolution;
- null, duplicate and non-domain values;
- distribution drift;
- cost per pipeline and per product;
- queries and active consumers;
- incidents, detection time and recovery time.
Lineage connects a source field to the final metrics. When an ERP changes the definition of a status, the team can identify the affected reports. Without lineage, the team starts investigating only after business leaders notice the problem.
Alerts have a budget. Too many non-actionable notifications cause them to be ignored. A rule without owner or procedure is not monitoring; it is noise.
9. Case study: unifying sales, inventory and margin
A distributor has an ERP, an e-commerce site, two marketplaces and a logistics tool. Teams consolidate twenty spreadsheets every Monday. Revenue is available at D+3 and stockouts are analysed after the fact.
The project does not begin by "centralising all data". It targets three decisions: restocking, adjusting promotions and finalising margin reporting.
Orders are ingested every fifteen minutes. Inventory data arrives every hour. Accounting remains in daily batch. Each source keeps an ID and a timestamp. The rules of return and commission are versioned.
A "saleable availability" product combines stock, reservations and non-shipped orders. Its SLA is twenty minutes, because beyond that point campaigns can promote an unavailable item. The "accounting margin" product remains at D+1 with financial reconciliation.
After launching, the pipeline detects that a marketplace sometimes returns the same event. The data contract blocks the duplicate before it affects margin. The most important gain is not a prettier dashboard: it is the ability to explain every figure and replay a day’s data.
10. Costs: measure by data product, not by platform-wide totals
The cost includes connectors, storage, calculation, transfer, licences, orchestration, observability, scheduling frequency and business time devoted to definitions. A migration adds to the temporary cost of running both systems.
Each expense is allocated to a data product. A table that has not been queried for six months does not have the same priority as a pipeline that feeds payments. The cost per query is not sufficient; the cost per decision or process is monitored.
The main levers are frequency, partitioning, incremental queries, retention, formats, compression and shutdown of unused products. Optimisation must maintain the SLA. Cutting compute at the cost of delivering after the meeting destroys value.
A budget of freshness helps: real-time is reserved for products that demonstrate the cost of delay. This rule prevents each team from requesting maximum infrastructure.
11. Team and responsibilities
The data engineer builds and operates the pipelines. The analytical engineer transforms the data into business models. The analyst explores and helps to decide. The data scientist develops the models. The data steward owns definitions, quality and usage. The architect ensures consistency. The business owner decides the meaning.
In a small organisation, a person can cover several roles. The responsibilities do not disappear. A lightweight RACI matrix states who produces, approves, is consulted and intervenes during an incident.
The data platform must not become a ticket service. Reusable templates, contracts and components allow domains to contribute with safeguards. Total centralisation slows delivery; decentralisation without shared standards fragments it.
12. A hundred-day roadmap
Days 1 to 20 — Choose two decisions. Inventory sources, define grain, name owners and measure the current lead time. Build the passport.
Days 21 to 40 — Build the minimum viable pipeline. Ingest a primary source, retain the raw data, test the schema and produce a business model. Perform a manual reconciliation.
Days 41 to 60 — Engineer reliability. Add contracts, automated tests, lineage, alerts and recovery procedures. Simulate a late source and a column change.
Days 61 to 80 — Enable governed self-service. Publish in the catalogue, apply rights, document metrics and support the first users. Measure usage.
Days 81 to 100 — Expand on the strength of evidence. Add a second source, automate reconciliation and compare value, quality and cost. Decide on subsequent products based on the decisions they support.
Success is measured by a reduction in response time, discrepancies and rework. The number of tables is not an indicator of maturity.
13. FAQ
13.1. Should all data be centralised?
No. Centralise what serves a proven decision, obligation or reuse. Some data is better left in the source system and consulted on demand.
13.2. Which tool should you choose first?
A managed warehouse, SQL and a simple orchestrator are often enough. The choice comes after the inventory of sources, volumes, timelines, skills and reversibility requirements.
13.3. Does a vector database belong in the data platform?
Yes when it serves research or AI, but it does not replace source storage, catalogue, permissions or quality controls. Embeddings are versioned derivatives.
13.4. How can you tell whether a pipeline is reliable?
It respects its SLA, detects anomalies before consumers, can be replayed, explains the lineage and has a tested recovery procedure. A history with no recorded incidents may simply indicate a lack of monitoring.
13.5. Who should define metrics?
The relevant business function decides the meaning, with finance or the relevant domain team. The data team formalises, tests and publishes. A definition imposed only by technology often lacks operational exceptions.
14. What data-engineering acceptance testing can demonstrate
Acceptance testing does more than validate that a pipeline “runs”. It starts from known decisions, selects reference records and tracks each value from the source to the final product. For a sale that is cancelled and partially refunded, the team must trace the raw status, transformation rule, exchange rate, allocation date and published amount.
The test pack contains three groups: nominal cases, documented limits and deliberately injected anomalies. Thresholds relate to accuracy, completeness, freshness, reconciliation and detection time. A blocking error stops publication; moderate drift can isolate the batch and maintain the latest reliable version.
Before opening up to all consumers, the business owner signs the definition, the technical team demonstrates recovery after failure, security checks access and an independent analyst reproduces several indicators without verbal guidance; this sequence, more demanding than a green-status screenshot, establishes that the system can withstand a delayed source, an incomplete schema, a duplicate and a retroactive correction while maintaining the history necessary to explain the decision.
The acceptance record is concise: evidence, accepted deviations, debt, owner and date. The transition to production never removes the known limits.
After thirty days, the review compares incidents, latency, reconciliations, costs, uses and support requests against the design assumptions, then decides to strengthen control, simplify a transformation, modify the source contract or remove a little-used table, so that the platform learns from actual use instead of silently accumulating pipelines whose value is no longer demonstrated.
15. Logiks recommendations
Start with two costly or slow decisions. Give each data product a passport, an owner, a contract and an SLA. Retain the raw data, test every boundary and make the transformations explainable. The objective is not to move all the data: it is to be able to trust the data that triggers action.
16. Main sources
- Eurostat, Larger enterprises used more e-business apps in 2025: https://ec.europa.eu/eurostat/web/products-eurostat-news/w/ddn-20260520-1
- Eurostat, Digital economy and society statistics — enterprises, 2025 data: https://ec.europa.eu/eurostat/statistics-explained/SEPDF/cache/33473.pdf
- Google Research, Data Validation for Machine Learning: https://research.google/pubs/data-validation-for-machine-learning/
- Google Research, The ML Test Score: A Rubric for ML Production Readiness and Technical Debt Reduction: https://research.google/pubs/the-ml-test-score-a-rubric-for-ml-production-readiness-and-technical-debt-reduction/
- European Commission, Data Act explained: https://digital-strategy.ec.europa.eu/en/factpages/data-act-explained
- European Commission, application of the Data Act since 12 September 2025: https://digital-strategy.ec.europa.eu/en/news/eu-data-act-gives-users-control-over-data-connected-devices