


Changing the colour of a button can produce a variation. This is not a CRO strategy.
A conversion depends on demand, promise, cost, proof, perceived risk, effort, performance and timing. The button comes at the end of this chain. The audit must locate the actual constraint before proposing a variant.
The right result can be an increase in the rate. It can also be less leads, but better qualified; more payment, but less refunds; a better activation, but no change in registration.
1. Key figures: frictions are frequent, intuitions unreliable
Baymard Institute aggregates 50 studies and calculates an average documented drop-off rate of 70.22% in its 2026 update. This average mix of sectors, periods and methodologies should not be used as a direct benchmark at a site. It shows the extent of the phenomenon to be analysed.
In Baymard's 2025 pattern study, 42% of the US buyers surveyed had abandoned because they were simply browsing or were not ready. This proportion cannot be "fixed" by the interface. Among the more actionable reasons, 17% cited an overly long or complex checkout.
Baymard's usage tests observed more than 2,700 problems on checkout routes. Their benchmark found 23.48 form elements displayed by default in the average U.S. checkout, while an ideal course could fall to about twelve elements in the cases studied. The institute estimates an average conversion potential of 35.26% for large e-commerces by correcting checkout problems; this potential is neither a guarantee nor an expected effect for each site.
Baymard's 2025 research classified 64% of desktop checkouts and 63% of mobile checkouts as "poor or worse" according to its methodology, so even established actors retain observable defects.
A summit of 34 experts from thirteen organisations, representing more than 100,000 treatments tested in a year, reported that about one third of the ideas significantly improved metrics and that one third degraded them. An audit must generate solid hypotheses, and then accept that they could fail.
Microsoft Research has also documented twelve frequent interpretation traps after the experience of thousands of tests. An A/B platform does not protect from bad metrics, loss of telemetry or post-hoc reading.
2. The conversion model: value, trust, effort and urgency
Logiks analyses each course with a qualitative equation:
Likelihood of action = perceived value × confidence × urgency / total effort.
It's not a statistical formula. It's a diagnostic framework.
The perceived value answers: "What do I get?" Trust: "Why believe the promise and confide my data or money?" The urgency: "Why act now?" The total effort includes understanding, comparison, capture, expectation, risk and recovery after error.
A discount sometimes increases urgency and value. It can reduce confidence, margin and brand perception. Therefore, the audit retains the safeguards.
3. Frame the result before the funnel
The mission identifies the priority outcome, followed by indicators that must not deteriorate.
For a SaaS: activation at seven days, with retention at thirty days, tickets and income per account. For an e-commerce: net orders and margin per visitor, with refunds, delay and support. For a B2B: opportunities accepted by the trade, then signing rate.
The form rate is only one step. A version can increase bids by 20% by removing a qualifying question, then saturating sales and reducing sales.
The window corresponds to the cycle. Short tests can measure clicks and registrations, but not quarterly retention. Early indicators are used with caution.
The scope lists traffic, aircraft, country, segments, offers, sources and off-site routes. The audit distinguishes acquisition, conversion and product.
4. Source 1 - Behavioural data
Quantitative analysis builds the route map: arrival, understanding, selection, engagement, form, payment, confirmation, activation and return.
For each step: eligible individuals, progression, abandonment, error, time, repetition and segment. Cohorts replace averages when behaviour matures.
The data is reconciled. An analytics purchase is compared to the server command. Submissions are linked to the CRM. The audit checks consent, duplicates and instrument changes.
Useful analyses include:
- funnel open and closed;
- path before and after error;
- time between stages;
- new/return;
- device, browser and performance;
- source and intent;
- customer segment and value;
- form by field;
- internal search without result;
- cohort before/after release.
Replays and heatmaps can help if their collection is consistent, sampled and protected. They show where the user clicks, not why.
5. Source 2 — The voice of users
The audit conducts moderate tests, interviews, contextual surveys and support analysis. The number depends on diversity. Five sessions can reveal a recurrent severe problem; they do not measure its prevalence throughout the population.
Tasks replicate the real. "Find a suitable offer for a team of twenty, check termination and buy" is more useful than "What do you think of the page?"
The auditor observes users’ mental models, misunderstood words, information sought, evidence consulted, hesitations, errors and recovery strategies. They avoid leading participants.
Interviews with lost or unconverted customers bring an absent perspective from current users. Commercials and media complement, not to speak in their place.
Each observation keeps verbatim short, context, frequency in the sample and consequence. A strong quote does not automatically become a global priority.
6. Source 3 — Expert assessment
The heuristic review covers clarity, hierarchy, consistency, control, error prevention, accessibility, mobile, performance and persuasion. It is based on benchmarks and context.
The expert shall, inter alia, verify:
- proposal of visible and specific value;
- correspondence between advert and landing page;
- prices, fees, timelines and conditions sufficiently early;
- evidence close to the statements;
- alternatives and comparisons;
- CTA describing the next step;
- proportionate form and recoverable errors;
- Invited purchase when relevant;
- trust in payment;
- keyboard navigation, focus and labels;
- performance on target device;
- There's no dark patterns.
A heuristic is not evidence of effect. It generates a hypothesis to compare with the data or a test.
7. Source 4 — Supply and economy
The CRO cannot compensate indefinitely for a misaligned offer. The audit compares price, packaging, warranty, trial, contract, delivery and perceived risk.
It analyses the contribution, not just turnover. A promotion that increases sales by 15% but reduces the margin by 20% and attracts more returns is a regression.
Options are tested according to their nature. A formulation can be tested in an A/B. A new prize sometimes requires a geographical, temporal or cohort experiment, with attention to fairness and perception.
The cost of serving a customer is included. Overly permissive onboarding can increase apparent activation and tickets.
8. Source 5 — Performance and reliability
Errors and slowness are measurable frictions. The audit cross Core Web Vitals, API latency, JavaScript errors, failure payment and conversion.
Correlation is not enough. Users on slow devices can belong to other segments. A correction can be deployed gradually or compared by version.
The degraded states are tested: slow network, refused payment, invalid promo code, expired session, changed stock, backward return. The ability to recover influences conversion and confidence.
Third party scripts are examined. A customization tool that adds 400 ms to each interaction must demonstrate a net gain.
9. Build the friction map
Each friction receives seven attributes.
| Attribute | Question |
|---|---|
| Step | Where does it occur? |
| Population | Who's concerned? |
| Evidence | Data, observation or hypothesis? |
| Severity | Abandonment, error, delay or doubt? |
| Frequency | known, estimated or unknown? |
| Cause | interface, offer, system, content? |
| Custody | what could the correction degrade? |
Example: the delivery cost appears after creating an account. Evidence: 31% of outputs at this stage, seven sessions looking for the price, verbatim support. Assumption: displaying an estimate earlier reduced the drop-out. Guards: accuracy according to postal code and margin.
The map distinguishes symptoms from causes. "A few CTA clicks" can come from an unclear offer, not from the button.
10. Prioritise with an enriched PXL framework
A priority score can combine: potential impact, volume, confidence, ease and learning. Logiks adds risk and reusability.
- Impact on metrics and safeguards;
- Population affected;
- Trust according to the convergence of evidence;
- Effort design, code, data and operations;
- Risk security, accessibility, brand, income;
- Learning value of information;
- Reuse component or knowledge created.
The notes are accompanied by a sentence. Otherwise, the score gives artificial precision.
An obvious correction of critical error does not need an A/B test if the test would delay the protection of users. Measurement before/after. A redesign of value proposition, on the other hand, deserves experience.
11. Design a valid experiment
The experiment brief contains:
- observation and evidence;
- supposed mechanism;
- change;
- population and randomization unit;
- Main metric;
- safeguards;
- Minimum detectable effect;
- duration and seasonality;
- quality control;
- decision for each outcome.
Example: "Prospects do not understand what happens after the form. Adding a timeline, deliverables and non-commitment will reduce uncertainty and increase attended appointments." The metric is not the click; it is the appointment held.
The sample size depends on the base rate, minimum effect, alpha and power. A calculation is made before the test. Stop as soon as the curve passes green inflates the false positives.
Experience covers at least one full business cycle. Sales, weekdays and campaigns are taken into account. A price or contract test may require more.
12. Quality of the experimentation platform
Before variants, the audit checks randomization, persistence, mutual exclusion, logs, telemetry and sample ratio mismatch. A test A/A may reveal systematic deviations.
Microsoft Research shows that loss of telemetry can bias results and reduce power. The audit compares assigned, exposed and measured volumes. It searches for different losses between control and treatment groups.
Multi-device users, refused cookies and caches can contaminate. The protocol documents the limit instead of ignoring.
Metrics are frozen before analysis. Exploratory segments are labelled and confirmed in a new test.
13. Read the results
The report presents group sizes, exposure, absolute effect, relative effect, interval, p-value or defined Bayesian approach, safeguards and anomalies. It explains the economic value.
Three results exist: positive, negative, and inconclusive. Inconclusive experience may indicate that the effect is below the useful threshold or that the sample is insufficient.
A positive result is deployed only if the safeguards are acceptable. The novelty can produce a temporary effect. A follow-up after launch checks the persistence.
Negative results are documented. They avoid repeating the same idea. Team performance should not depend on the percentage of "winners", otherwise it will choose easy metrics.
14. Practical case: the short form that destroys quality
A B2B company reduces its form from nine fields to four. Bids increase by 28%. The team celebrates the test.
Three weeks later, salespeople reported more off-target requests. The deleted team size field was used to route and prepare the conversation. The honoured appointment rate was decreasing.
The audit recalculates the channel: bid +28%, lead accepted –9%, appointment held –6%, stable opportunity, commercial time +14%. The test optimised the wrong level.
A new variant retains four visible fields, then asks for the size after submission in an optional orientation step. It explains the profit. The routing also uses authorised company data.
The main metric becomes an opportunity accepted per visitor, with commercial time and completion rate as a guard. The form does not simply return to the old state; the friction is redesigned.
15. The CRO audit score
Logiks notes separately: clarity of offer, confidence, effort, UX/accessibility, performance, measurement, quality of experimentation and economy. Each note cites the evidence.
The overall score is capped if the conversion is not reconciled to the business system or if the safeguards are absent. An organisation that multiplies tests without reliable telemetry is not mature.
Opportunities are grouped: immediate corrections, quick tests, further research, product sites and offer topics. This classification avoids forcing each problem into an A/B test.
16. Deliverables expected
- conversion model and result metrics;
- tracking audit and experience quality;
- funnel analysis and segments;
- user search synthesis;
- friction card with proof;
- prioritised backlog and safeguards;
- records of the first ten experiments;
- A/B platform audit;
- economic reading table;
- programme 30, 90 and 180 days.
Sensitive recordings remain protected. Verbatims are minimised. hypotheses are separated from findings.
17. Frequently Asked Questions
17.1. What conversion rate should be targeted?
There is no universal benchmark. Channel, price, maturity, device and definition change everything. Compare cohorts and net value, then estimate potential by friction.
17.2. Do you need a minimum level of traffic for CRO?
The CRO includes search, correction and measurement before the A/B testing. With little traffic, use user tests, prototypes, conservative time series and strong evidence changes. Do not make an impossible significativity.
17.3. How many tests should you run?
As much as the platform can instrument and learn without conflict. The quality of hypotheses and reading counts more than volume.
17.4. Does a CRO audit cover the price?
Yes as a value and risk factor, but a full pricing strategy may require dedicated research and analysis. Price testing requires legal, ethical and economic precaution.
17.5. When will the audit be repeated?
After redesign, change of supply, major source of traffic or fall, then every 12 months. Backlog and quality of experimentation are continuously reviewed.
18. What the audit can secure: tests and safeguards
A CRO hypothesis links observation, mechanism, change and result. "Creating the form" becomes: mobile prospects abandon after the fields undertaken because they do not have the information; delaying two fields should increase the complete folders without reducing the rate of leads accepted.
The backlog retains source, population, page, effort, expected impact, main metric, safeguards and necessary proof. The priority does not come from a decorative addition of confidence and impact; a severe but rare friction does not always pass before a moderate defect on the main path.
Before launch, the control checks assignment, exposure, events, consent, bots, performance, devices and ability to go back. The results report effective, duration, effect sizes and uncertainty, not just "winner" or "loser".
When a variant increases submissions by 22%, the team waits to know if contacts are reachable, if CRM accepts them, if appointments are held, if the business load remains absorbable, if the response time changes and if refunds or unsubscribes increase; this expanded reading prevents local optimisation from transforming visible conversion into hidden cost for the rest of the system.
A negative result remains useful if the implementation was valid. It reduces uncertainty, closes a track and prevents the cyclical return of the same idea. The victory rate does not evaluate the team.
An obvious correction of accessibility or bug does not always require randomised experiment. It requires acceptance testing. Experimentation is reserved for changes whose net effect remains uncertain.
The post-deployment review compares the exposed cohort, economic metrics, faults, support and performance with the reference, then searches for the effects that appear after the initial window; it can remove a variant declared winning if the advantage dissipates, if the client mix changes or if an downstream load exceeds the benefit, which protects the programme from the accumulation of local wins that have become collectively costly.
The register keeps the code, the capture, the population, the exclusions and the decision. A future test can thus build on the evidence instead of repeating the same debate.
Finally, the roadmap distinguishes between the corrections to be made, the hypotheses to be tested, qualitative research and the decisions to offer. Each one has an owner, a dependency and a deadline. This separation prevents competing a blocking bug, an idea for a message and a tariff recast in the same supposedly scientific priority score.
The scope remains explicit.
19. What Logiks recommends
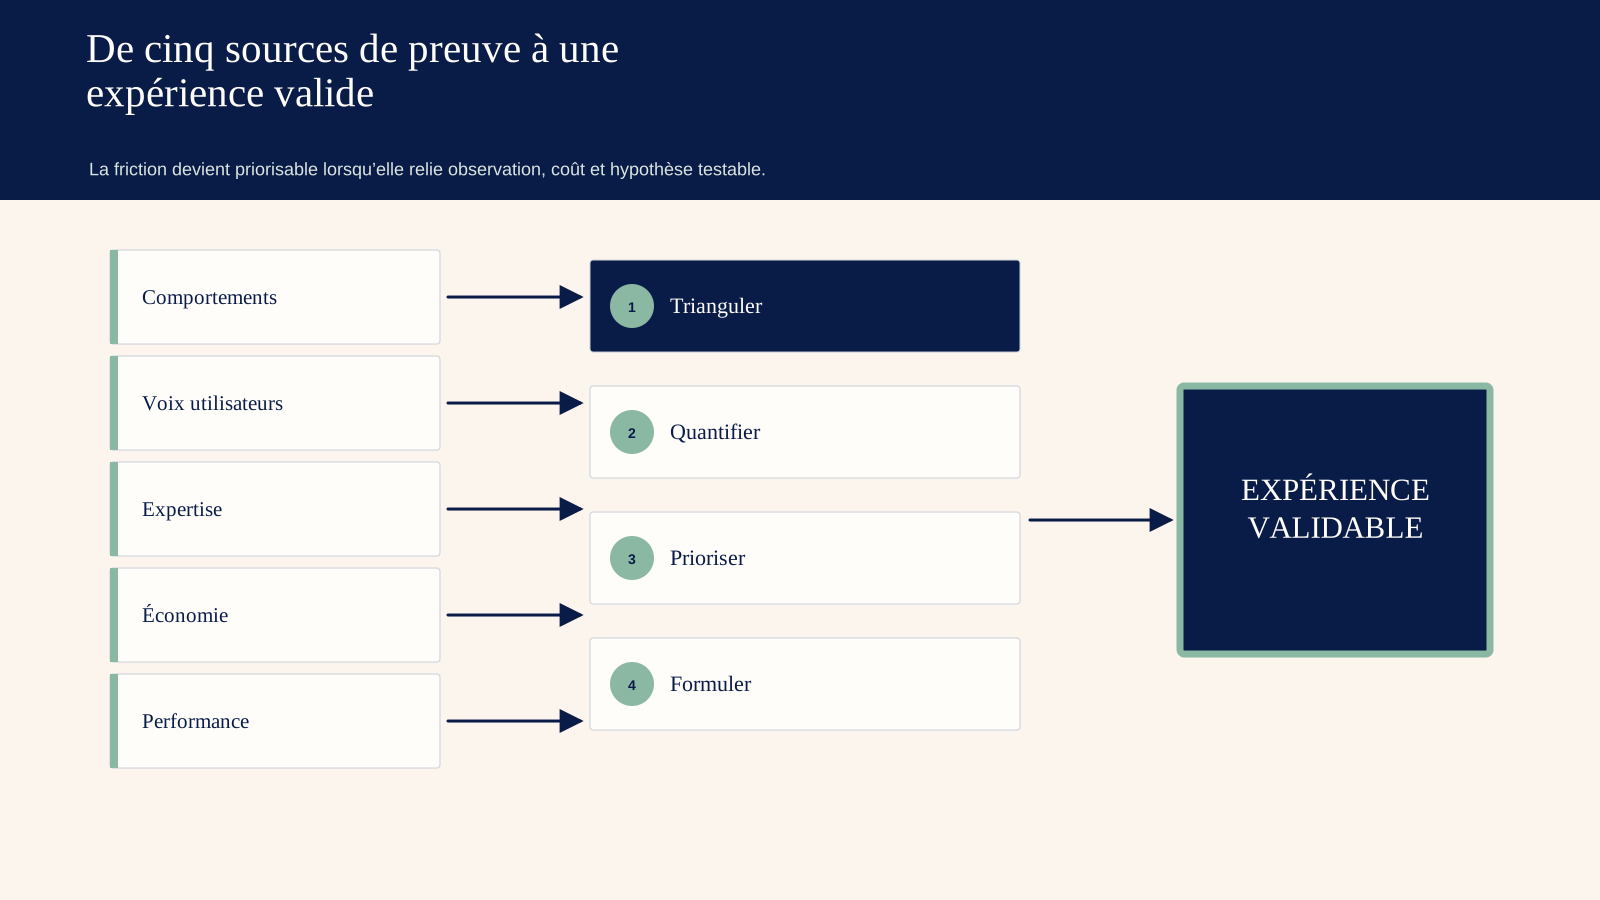
First define the economic conversion and its safeguards. Cross data, users, expertise, offers and performance to build the hypotheses. Test the mechanism, not the decorative component. Then also document the failures: a mature CRO programme maximizes cost-effective learning, not the number of winning variants.
20. Main sources
- Baymard Institute, average of 50 drop-out studies, update 2026: https://baymard.com/lists/cart-abandonment-rate
- Baymard Institute, reasons for abandonment and search checkout 2025: https://baymard.com/blog/ecommerce-checkout-usability-report-and-benchmark
- Baymard Institute, UX 2025 Checkout Status: https://baymard.com/blog/current-state-of-checkout-ux
- Microsoft Research, Top Challenges from the first Practical Online Controlled Experiments Summit : https://www.microsoft.com/en-us/research/publication/top-challenges-from-the-first-practical-online-controlled-experiments-summit/
- Microsoft Research, A Dirty Dozen: Twelve Common Metric Interpretation Pitfalls : https://www.microsoft.com/en-us/research/publication/a-dirty-dozen-twelve-common-metric-interpretation-pitfalls-in-online-controlled-experiments/
- Microsoft Research, Trustworthy Experimentation Under Telemetry Loss : https://www.microsoft.com/en-us/research/publication/trustworthy-experimentation-under-telemetry-loss/