

A model detects defects with 98% accuracy in laboratory images. In the factory, a new lighting setup creates reflections, the operator rotates the part and the camera accumulates dust. Performance collapses without the code changing.
Computer vision begins in the physical world.
1. Definition: computer vision measures a scene to support an action
Computer vision includes image classification, object detection, segmentation, tracking, visual OCR, pose estimation, 3D reconstruction and video analysis. It turns pixels into actionable information for a process.
It can control a defect, count a stock, read a dial, assist an inspection, measure occupancy, or guide a machine. Biometric recognition is a sensitive subset, subject to particular risks and rules.
The complete product includes optical, sensor, position, network, model, threshold, interface, action, log and maintenance. Comparing only the accuracy of the model amounts to evaluating an industrial chain from a single gear.
2. Key figures: strong progress, gaps that remain material
- In its demographic facial recognition study, NIST estimated 189 algorithms from 99 developers on four datasets totaling 18.27 million images of 8.49 million people.
- For some verification algorithms 1:1, false positive rates varied between groups by factors often ranging from 10 to 100, according to NIST. The best systems did not have all these gaps, making choice and contextual testing indispensable.
- NIST states that false negatives are highly dependent on image quality and that underexposure or poor capture can create or exacerbate demographic differences. Correcting the capture device can count as much as changing the model.
- The Stanford AI Index 2026 notes that benchmarks are progressing or saturating rapidly, so a general benchmark does not guarantee performance on the camera, objects and conditions of a site.
- MLPerf Inference v5.0 published 17,457 results performance from 23 organisations and includes edge, data center and automotive 3D detection tasks. MLPerf also measures energy from the complete system to the wall for Power submissions.
- The EU AI Act has banned several uses since February 2025, in particular the constitution or extension of facial-recognition databases through untargeted scraping, certain forms of biometric categorisation and recognition of emotions at work or school, except defined exceptions.
A performance metric cannot be interpreted in isolation. It must remain tied to the task, the threshold, the dataset, the device and the population.
3. The visual-system blueprint: ten components to decide
As with an industrial-system blueprint, each component is linked to a requirement and supporting evidence.
4. Component 1 — The decision before the image
Write what will change: removing a defective part, requesting a second inspection, alerting an operator, counting items on a shelf, or measuring a line. Name the time, the person and the consequence.
"Finding faults" remains vague. "Report before packaging scratches greater than 2 mm on the visible face, then have the operator confirm it" defines object, size, area, time and supervision.
A decision without action does not offer value. A visual inventory produces data, but the benefit only occurs if replenishment, maintenance or layout uses it.
5. Component 2 — The scene and its variations
Document distance, angle, light, vibration, speed, occlusion, background, weather, dust, temperature and human behaviour. Probable variations must enter the test.
5.1. Design lighting
The same scratch appears or disappears according to reflection and polarization. Controlled lighting, a hood or a synchronised trigger sometimes reduces the error more than a larger model.
Measure illumination and sensor condition. An image drift alert — blurred, obstructed, exposed, moved — protects the service even before prediction.
5.2. Define the observable area
A camera does not see behind a part, under a packaging or outside the frame. If the truth requires several views, add sensors, positioning or new step rather than requiring the model to have no information.
The physical specification precedes the dataset.
6. Component 3 — Optics, sensor and frame rate
Resolution, focal length, shutter speed, dynamic range, frame rate, depth and compression determine the details available. A two-millimetre defect must occupy enough pixels under the most difficult conditions.
Calculate data throughput. Four 4K cameras at 30 frames per second can produce considerable volumes; processing all images, sampling or triggering at the event changes network, storage and cost.
Test the system's end-to-end latency. A 99% detection arriving after the object has left the ejection mechanism fails operationally.
Choose replaceable and calibrated equipment. The most accurate camera in the laboratory can be fragile, unavailable or impossible to clean in the field.
7. Component 4 — Representative dataset
The dataset covers classes, conditions, sites, equipment, operators, seasons and rare cases. Its size depends on the diversity and level of error expected, not on a universal quota.
7.1. Organise dataset splits
Separate by lot, site, date or object, not just by image. Two adjacent frames of the same video in training and testing create an almost perfect leak.
Keep a frozen final test, a stress test and a future flow. A model that memorizes the background of site A may fail at site B despite a high overall score.
7.2. Search for difficult negatives
Crack-like reflection, dirt, partially hidden object, neighbouring pattern or empty area: false positives are found in what looks like the target. Collect these cases intentionally.
For rare events, use simulation or data augmentation with caution. A synthetic image must be validated against the real and does not replace the coverage of physical conditions.
8. Component 5 — Annotation and ground truth
Write a guide: classes, boundaries, partial objects, overlaps, uncertainty and exclusions. Train the annotators, measure their agreement and have an expert resolve disagreements by an expert.
A box around an object does not necessarily define a defect. For segmentation, specify the edge; for safety action, distinguish presence, proximity and dangerous situation.
Labels may reflect subjective judgement. If two inspectors agree on only 85% of cases, the model should not be announced at 99% without explaining the reference and method of arbitration.
Version annotation and taxonomy. Adding a class modifies the old metrics and sometimes requires a reannotation.
9. Component 6 — The model and task-level metric
9.1. Classification
Accuracy, precision, recall, confusion matrix, calibration and threshold result. On a rare class, the average accuracy is not very informative.
9.2. Detection
Precision/recall and mAP at different thresholds of Intersection over Union. A rough box may be enough to count, but not to guide a robot.
9.3. Segmentation
IoU or Dice, supplemented by size, edge and consequence measurement. A small forgotten defect can weigh little in the pixel metric but much in the risk.
9.4. Tracking
Lost identities, switching, trajectories, latency and counting. A counted person three times produces a bad decision despite correct frame detection.
Report by class, site, condition and equipment. The averages hide the scenario that will become the incident.
10. Component 7 — Threshold and cost of errors
The false negative lets pass the defect; the false positive rejects a good part. Quantify scrap, rework, downtime, warranty, safety risk and inspection burden.
If a critical defect affects 0.1% of the parts, a high recall is a priority, but fatigue of alerts limits the number of false positives. A cascade can use a sensitive model and then a second verification or a human inspection.
Calibrate the threshold by consequence class, not to maximize an abstract F1. Unknown conditions trigger increased abstention or control.
A score is not a certainty. The interface must express it without asking the operator to become a statistician.
11. Component 8 — Edge, cloud or hybrid architecture
11.1. Edge
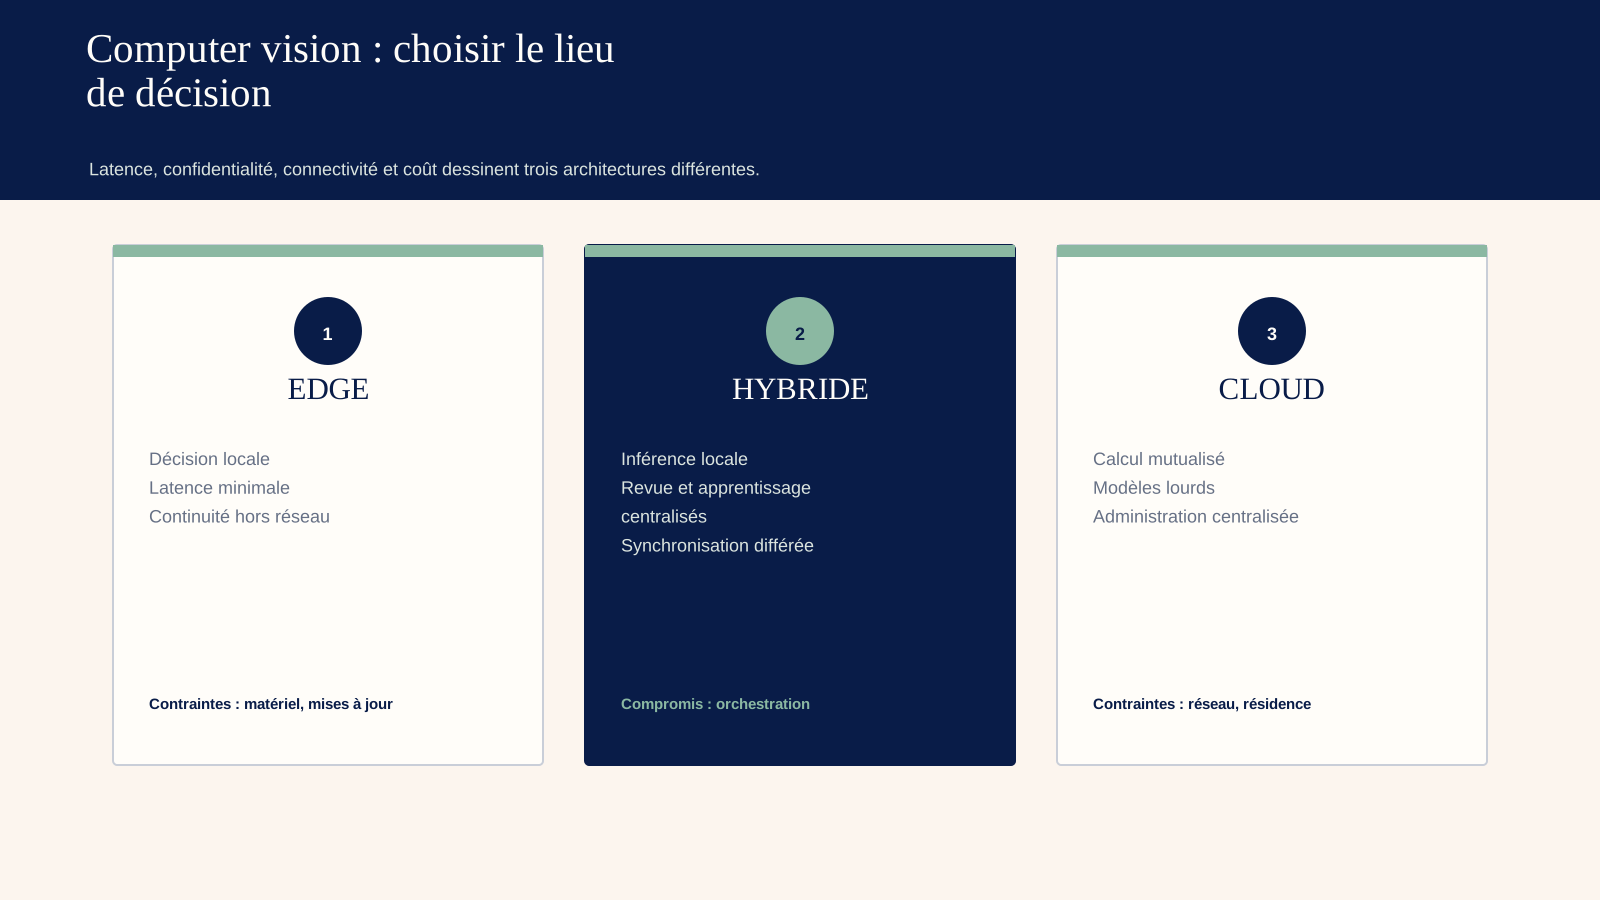
On-site treatment reduces latency, bandwidth and exposure, and can operate off-grid. It imposes limited capacity, fleet management, updates and monitoring of distributed equipment.
11.2. Cloud
It facilitates pooling, power and central deployment, but adds transfer, latency, cost, network dependency and data location issues.
11.3. Hybrid
The site filters or performs inference in real time; the cloud aggregates, retrains and analyzes. Only necessary images are uploaded under the applicable policy.
Benchmark on the full configuration. MLCommons recalls that performance and energy depend on hardware, software, numerical accuracy, batch and scenario; an isolated manufacturer figure does not predict the factory.
12. Component 9 — Human review and action
The operator sees the image, area, class, rule, history and expected action. They may confirm, correct, refuse and report an unknown condition.
Avoid contextless alerts and screens too fast. Measure response time, correction, fatigue, bypass and load, especially during peaks.
Supervision must not transfer responsibility without authority. If the line cannot be stopped or if the cadence prevents the image from being seen, the control is nominal.
Human corrections feed into a review pipeline, not directly into the model. They may be wrong, influenced by prediction or unrepresentative.
13. Component 10 — Operations, drift and evidence
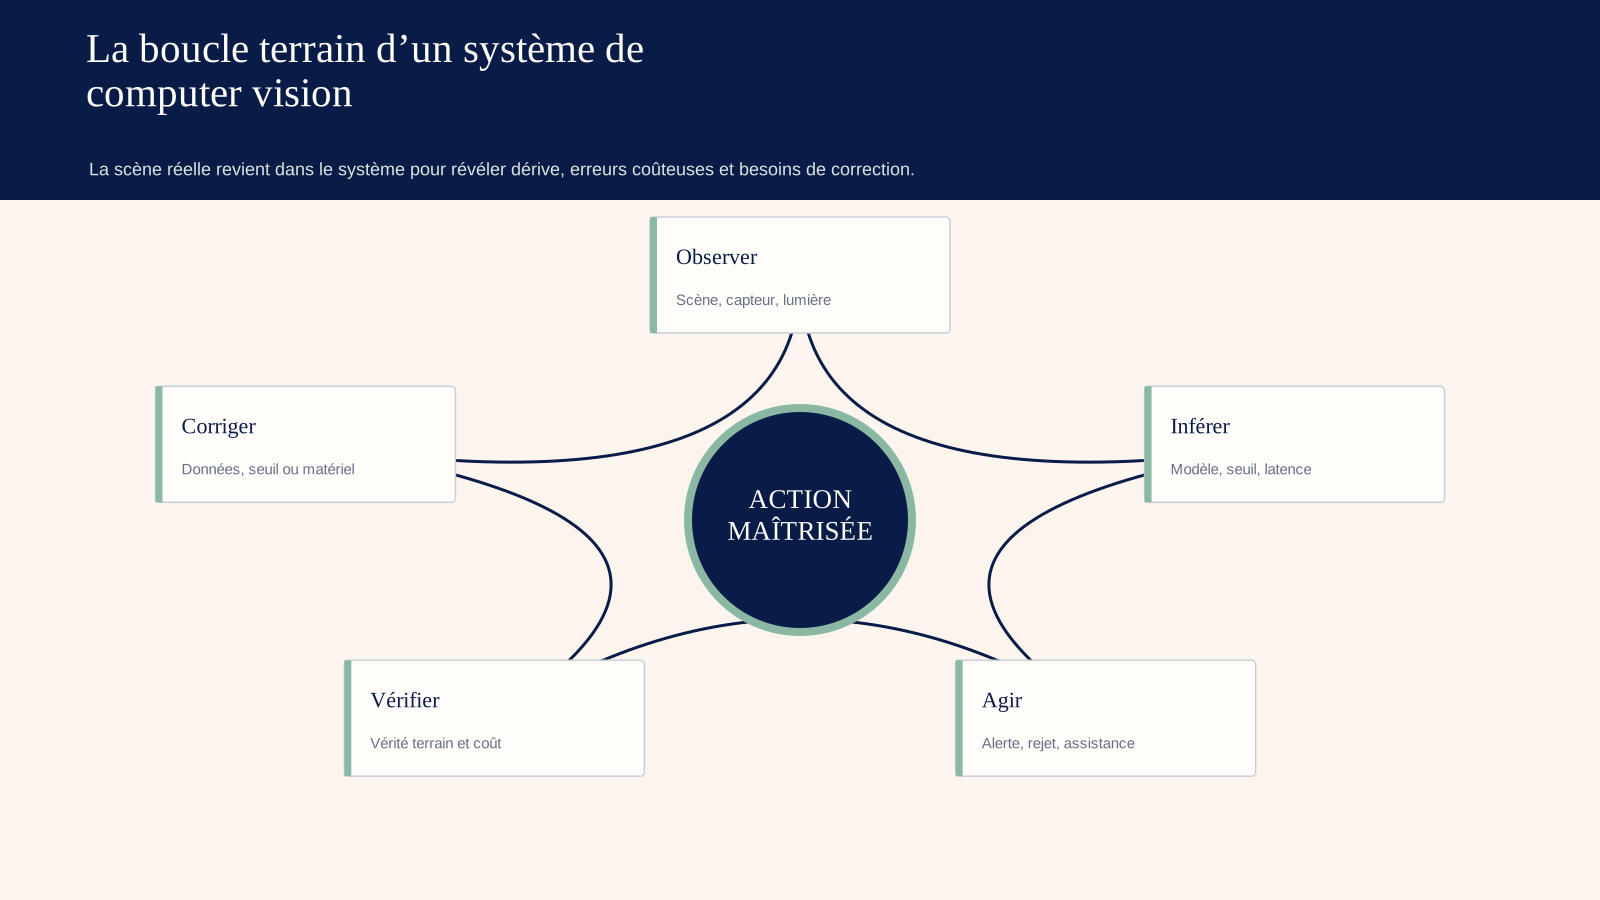
Monitor image quality, distribution, class rate, confidence, confirmed errors, latency, availability, temperature, storage and cost. One indicator per camera locates physical problems.
13.1. Detect three drifts
- scene: light, framing, decor, equipment;
- object: new product, material, defect;
- process: rate, threshold, action, policy.
Plan for cleaning, calibration, replacement, update and rollback. One version is deployed per site with non-regression testing and a canary release.
Keep the source image when justified, together with the prediction, model, threshold, action and correction, depending on retention and rights. the log must allow the investigation without creating unlimited video surveillance.
14. Costed case: quality control across 2 million parts
A line produces 2 million parts per year. The current inspection samples 5% to 0.40 € per controlled part, i.e. 40,000 €, and lets pass defects estimated at 180,000 € warranty.
The visual system costs 120,000 € for integration, 45,000 € per year for equipment, calculation and maintenance, plus a review of €0.02 per part for 8% of cases, i.e. 3,200 €. The system inspects the entire volume.
At the chosen threshold, critical-defect recall is 97% and precision is 62%. The accuracy seems weak, but the second review and a physical rule eliminate some of the false positives before scrap. Warranty costs drops to €45,000 and false rejects cost €30,000.
Annual cost after deployment: 45,000 + 3,200 + 45,000 + 30,000 = 123,200 €, if the residual guarantee is retained. The current system costs around 220,000 €. Gross savings reached €96,800 € before depreciation, stops and change.
The simple payback period on €120,000 € exceeds fifteen months. A new light that reduces the recall to 85% would destroy part of the gain; image monitoring and calibration therefore belong to the calculation, not to optional maintenance.
The numbers are illustrative. The method requires linking metrics, action and real cost.
15. Biometrics and people: a separate pathway
Do not transpose a manufactured-part inspection process to human identification. False positive, consent, asymmetry of power, bias, oversight and law produce fundamental consequences.
The NIST distinguishes 1:1 verification and 1:N identification, false positives and false negatives. The study shows strong differences between algorithms and groups, without allowing a general conclusion on any current product.
The European Regulation prohibits certain practices and classifies several biometric systems as high-risk, with a changing regulatory timetable in 2026. Check purpose, legal basis, necessity, proportionality, impact assessment and obligations with the relevant teams before any collection.
A non-biometric alternative should be studied. If a non-identifiable badge or sensor meets the need, facial recognition may be disproportionate.
16. Five-stage deployment programme
16.1. Stage 1 — Instrument without a model
Install camera and light, measure images, cadence and conditions. Check that the target is observable.
16.2. Stage 2 — Collect and annotate
Sample production, incidents and variations. Write the guide, measure inter-annotator agreement, freeze test.
16.3. Stage 3 — Shadow mode
Infer without acting. Compare inspections, locate errors and test latency/architecture.
16.4. Stage 4 — Assisted action
Present the alert and let the operator decide. Measure workload, corrections and economics.
16.5. Stage 5 — Limited automation
Automate reliable and reversible cases, keep sampling, shutdown, review and drift. Expand site by site.
This Logiks programme voluntarily slows down the power of action, not learning.
17. Logiks recommendations: eleven mistakes that a demo can hide
- Mix frames from the same video between train and test.
- Choose clear pictures that are missing from the field.
- Publish only the global MAP.
- Ignore a rare and critical defect.
- Forget the cost of fake scrap.
- Inadequate lighting and cleaning.
- Test the model, not the complete latency.
- Send back all images without policy.
- Train on unvalidated corrections.
- Deploy biometrics as an object count.
- Do not provide manual mode.
The real world always catches up with the demo.
18. FAQ
18.1. How many images do you need?
This depends on the classes, variations, targeted errors and pretrained model. Measure coverage; a few thousand diversified can be worth more than millions of nearby frames.
18.2. Edge or cloud?
Edge for latency, resilience and minimisation; cloud for pooling and power; hybrid often to combine. Benchmark system and full cost.
18.3. Accuracy, precision or recall?
The choice depends on the error. For a rare defect, accuracy misleads; precision indicates alert quality, while recall indicates coverage of the real defects.
18.4. How do I detect drift?
Monitor image, object, classes, confidence, confirmed errors and business results. Add site tests and sample inspection.
18.5. Can we use synthetic images?
Yes to complete cases, provided that their realism is validated and maintain a real independent test. They do not replace the field collection.
18.6. Is facial recognition allowed?
This depends on purpose, context and law. Certain practices are banned or highly regulated in the EU; legal and data protection analysis is essential.
19. Field test: images, camera, false defects and site drift
The final validation does not only take place in a notebook. It takes place in front of the line, warehouse, on-board camera or checkpoint, with the people who will receive the alerts and make the decision.
First passage: normal day. We measure rate, availability, response time, relevant alerts, unread objects and review load. Second passage: difficult conditions. Oblique lighting. Reflections. Vibration. Dust. Damaged packaging. Partially hidden product. Third passage: prepared incident. Network outage, moved optics, slow flow, unknown batch and back to manual mode.
The minutes retain eight values: volume presented, volume analysed, confirmed events, correct alerts, missed events, unnecessary alerts, abstentions and duration of unavailability. It adds the human time devoted to verification. This last item often changes the economics of the project: an early but ambiguous alert mobilizes an operator, slows down the process and ends up being ignored.
Each scene receives its own reading. Strong morning performance does not offset weak night-time performance. A frequent reference does not hide the rare reference. The new workshop is not confused with the one that provided the initial images. This segmentation reveals useful boundaries, where an overall average gives a sense of security too wide.
The launch threshold is not just a percentage. It combines capacity, cost of error, pace of work, appeal procedure and acceptable duration of the fallback mode. For example, the service starts if the coverage exceeds the agreed threshold of the five priority classes, if no critical non-detection occurs during two complete shifts, if the review remains within twenty minutes per hour, if the manual shift takes less than three minutes and if the teams can explain, from the test report, why each tolerated exception does not threaten security, or production, or the future ability to compare two versions under identical conditions.
The criteria are decided before the demonstration. Otherwise, the team will spontaneously move the bar to save several weeks of work. The business manager signs. The operator signs. Security signs when the data flow leaves the controlled environment. For a scene involving people, the DPO and the competent representatives intervene according to the context.
Four exits are possible. Limited launch. New collection. Modification of the optical device. Stop. This last option counts. A case that is physically unstable, too rare or too expensive to supervise does not become profitable thanks to greater confidence in the algorithm.
After opening, a viewing window compares acceptance testing to daily conditions. Corrections are sampled, reviewed and only then used to enrich the corpus. A confirmed drift triggers a precise action: recalibrate the camera, correct the procedure, enrich the representation, adjust the threshold or suspend the flow. Investigate physical causes before escalating to software changes.
The acceptance test is brief. Vigilance continues.
20. Conclusion
Computer vision does not look at the world as it is. It sees what the sensor, light, data and model make visible.
Start with the decision and the scene. Build a separate test by site and time. Measure errors by cost. Choose the complete architecture. Finally, give the human real control and give the service a physical maintenance plan.
Reliability is built in front of the camera.
21. Main sources
- NIST, Face Recognition Vendor Test Part 3: Demographic Effects, NISTIR 8280: https://www.nist.gov/publications/face-recognition-vendor-test-part-3-demographic-effects
- NIST, synthesis of the demographic study, December 19, 2019, update 2025: https://www.nist.gov/news-events/news/2019/12/nist-study-evaluates-effects-race-age-sex-face-recognition-software
- NIST, FRTE Demographic Effects, updated tables: https://pages.nist.gov/frvt/html/frvt_demographics.html
- Stanford HAI, AI Index Report 2026 — Technical Performance: https://hai.stanford.edu/ai-index/2026-ai-index-report/technical-performance
- MLCommons, MLPerf Inference v5.0 Results, April 2, 2025: https://mlcommons.org/2025/04/mlperf-inference-v5-0-results/
- MLCommons, Inference Edge — Power measurements: https://mlcommons.org/benchmarks/inference-edge/
- European Commission, AI Act — prohibited practices and risk levels, July 2026: https://digital-strategy.ec.europa.eu/en/policies/regulatory-framework-ai