


A dashboard can be perfectly accurate and perfectly useless. It can display a thousand events without answering the question of Monday morning: do we need to increase the budget, fix the funnel, reactivate this segment or stop this feature?
Conversely, three well-defined metrics can change an important decision.
The measurement system therefore does not start with the tool. It starts with the decisions the organisation must make, the time available to it and the cost of an error. Instrumentation follows. Reporting closes the loop by showing the deviation, its explanation and the proposed action.
1. Key figures: measurement capacity remains unevenly distributed
Eurostat reports that 39.85% of European Union enterprises with at least ten employees performed data analyses in 2025, either internally or with a provider. 33.02% mobilised their own employees and 13.85% used an external organisation, some combining the two.
Tools alone are not enough. The same survey recorded 16.28% of enterprises using business intelligence software, with a 58-percentage-point gap between small and large enterprises: about 11% compared to 69%. As a result, a company can own an ERP and CRM without a shared management language.
Consent constraints have also changed the nature of the figures. Google Analytics explains that when a user refuses analytics identifiers, their events are not linked to a persistent identifier; then ten page views do not reveal whether those views came from one person or ten. The platform can model certain behaviours from consenting users, but modelled output must be distinguished from observed data.
Since June 15, 2026, Google has stated that Consent Mode is Google Ads’ single control over the collection of cookies and advertising identifiers through Analytics tags for related properties. This recent development makes a configuration register essential: documentation written in 2024 may no longer describe current behaviour.
In 2025, CNIL issued two fines of EUR 325 million against Google and EUR 150 million against Shein, in particular for tracker-related breaches. These amounts do not constitute risk pricing for an SME. They show that the consent banner and the actual triggering of tags are compliance controls, not decoration.
Finally, measurement does not protect against the wrong decision. At a summit of 34 specialists from thirteen organisations, including Airbnb, Amazon, Booking.com, Google, Microsoft and Netflix, the companies represented had tested over 100,000 variants in one year. The published findings indicate that about one third of the ideas tested significantly improved metrics and that another third degraded them. Product intuition alone is an unreliable filter.
2. The decision sheet: the starting point
Before any event, Logiks recommends writing a decision brief for each decision.
| Field | Example: increase a campaign budget |
|---|---|
| Decision-maker | head of acquisition |
| Frequency | each Monday |
| Decision | +20%, hold, reduce or stop |
| Targeted outcome | incremental margin at 90 days |
| Primary metric | net contribution per euro spent |
| Guardrails | refund rate, cash flow, saturation |
| Segments | channel, campaign, cohort, new customer |
| Time to a reliable outcome | 30 to 90 days depending on product |
| Uncertainty | unattributed sales and consent gaps |
| Threshold | increase if interval and capacity allow |
| Action if data is missing | maintain, do not extrapolate |
This brief forces the team to separate the vanity metric from the economic result. The number of clicks helps to diagnose a campaign. It does not justify a budget alone.
It also reveals the actual time frame. A sale observed today can be refunded tomorrow. A customer acquired this month can become profitable on the third purchase. Reporting must show sufficiently mature cohorts.
3. The metric tree: linking strategy and events
A primary metric does not stand alone. It is broken down into actionable factors.
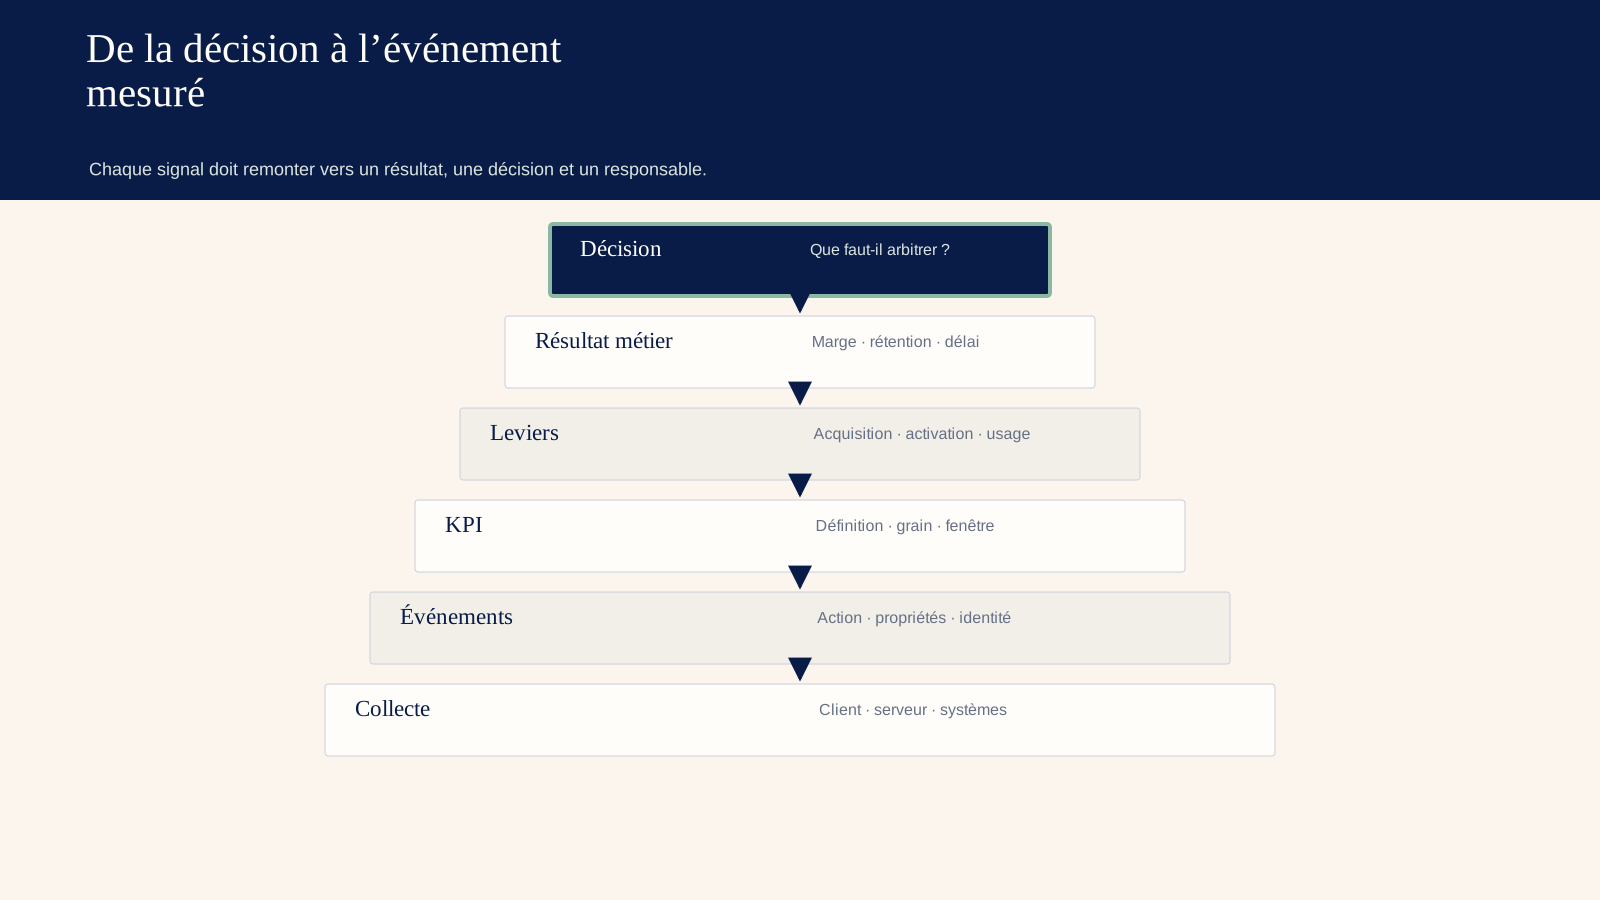
For a subscription service:
Net recurring revenue = active customers × average revenue × retention rate, after discounts and refunds.
The number of active customers depends on new subscriptions, reactivations and cancellations. New subscriptions depend on eligible traffic, activation, conversion and successful payment. Each branch has events and one owner.
The tree helps explain a movement. A drop in revenue may come from lower traffic, lower conversion, a mix of plans or an increase in cancellations. Without this structure, the team looks for a cause in twenty independent charts.
Three types of metrics coexist.
Outcome. Net revenue, margin, retention, processing time or satisfaction. This confirms value, often with a delay.
Lever. Activation, adoption of a function, quote acceptance rate. It can be influenced by the team.
Guardrail. Complaint, error, refund, cancellation or response time. This prevents harmful local optimisation.
A vanity metric is not necessarily useless. Impressions or page views are used for diagnosis. They become dangerous when presented as a result.
4. The measurement dictionary
Each indicator has a computable definition. Let's take "conversion rate."
The numerator, denominator, unit, window, time zone, exclusions, duplicates, refunds, bot filtering, source and effect date should be specified. "Purchases / sessions" and "buyers / eligible users" do not tell the same story.
A minimum dictionary includes:
- business name and technical name;
- question the metric answers;
- formula and grain;
- eligible population;
- time window;
- source of truth;
- thresholds and safeguards;
- known limits;
- owner;
- change history.
The metrics committee must not approve each graph. It resolves shared definitions: active customer, net order, acquisition channel, margin and cohort. Product teams can then create compatible local measures.
5. The tracking plan: instrumenting a contract
The tracking plan translates important behaviours into events. An event describes what happened, not the screen on which a click took place.
checkout_startedis more stable thanbutton_blue_clicked. It can be triggered from a website, an app or a future interface. Its properties specify the basket, currency, channel and experience.
Each event has: name, definition, trigger, properties, source, identifiers, consent required, criticality, version and test. Business events are distinguished from interface events.
A purchase journey might contain:
product_viewed;cart_updated;checkout_started;payment_submitted;order_confirmed;order_refunded.
Revenue should not depend solely on browser-side data.order_confirmedandorder_refundedideally come from the server or financial system, with an identifier allowing deduplication. The front end describes the experience; the server confirms the economic fact.
6. Identity: do not confuse person, device and session
Tracking uses several identifiers: cookie, application installation, connected account, order and CRM lead. Linking them requires a rule and a legal basis. Merging too early can attribute the activity of a shared device to a person.
An internal pseudonymous identifier is preferable to the email address sent to each tool. Direct identifiers remain within a tightly controlled scope. The matching table is protected and its retention period defined.
An anonymous user may later sign in. The system decides whether earlier activity is linked, from what point and for what purpose. This decision influences cohorts and compliance.
Reporting specifies the unit: observed users, devices, sessions, accounts or estimates. Writing “unique visitors” masks a technical convention.
7. Consent: three architectures, three readings
Measurement can follow three complementary paths.
Measurement subject to consent. Advertising tags and certain analytics functions are fired according to the user’s choice. Consent must be collected, recorded, transmitted and withdrawable.
Consent-exempt audience measurement under strict conditions. CNIL indicates that certain trackers strictly limited to audience measurement on the publisher's sole behalf may be exempted. Purposes, duration, reuse by the service provider and transfers must meet its criteria. The name of a tool does not guarantee exemption; its actual configuration counts.
First-party operational data. Orders, payments, tickets and contracts exist to execute the service. Their analytical reuse must be governed, but it offers a source closer to the result than the advertising pixel.
The consent banner is tested as a feature. Before the user chooses, no unauthorised tag fires. Refusal is as simple as acceptance. Withdrawal updates processing. Consent states are propagated to each tool. A screenshot does not provide this evidence; network requests and logs provide it.
8. Observed, attributed, modelled: three layers to separate
A sale observed in the ERP is an operational fact. Its connection to a campaign is an attribution. The estimation of non-observable sales is a model.
All three can be useful. They must not be mixed without a label.
Google describes, for example, a "blended" reporting identity that combines observed and modelled data when the conditions are met. The platform displays a quality indicator, but the organisation still needs to document which views feed into its decisions.
The dashboard may show:
- total revenue confirmed by finance;
- revenue with observed source;
- revenue allocated according to a given rule;
- complement modelled by the platform;
- unallocated share;
- interval or limit of measurement.
Thus, an improvement in the consent rate will not be confused with a real increase in sales.
9. Attribution: a convention, not causality
Last-click assigns the sale to the last contact. First-click attribution credits discovery. A positional or data-driven model distributes the credit. None of them prove what would have happened without advertising.
Attribution is used for day-to-day management and diagnosis. Incrementality answers the causal question. It compares an exposed group with a control group when randomisation or quasi-experimental design is possible.
A mature team uses both: attribution to navigate, experimentation to calibrate. If a channel receives 40% of the credit but generates only 20% incremental sales in the tests, the budget should not blindly follow the platform report.
The windows are documented. A branding campaign and a prospecting campaign do not have the same cycle. Changing the window changes the results without changing the customer behaviour.
10. Test telemetry before testing the product
An A/B test requires sound instrumentation. Microsoft Research points out that loss of telemetry can introduce bias, reduce statistical power and lead to erroneous conclusions. The problem has been studied on applications with millions of users and billions of sessions.
Before the experiment, we check:
- random and persistent distribution;
- balance of groups on basic variables;
- no leakage between variants;
- events received in both groups;
- identity and deduplication;
- consistency with the server source;
- duration covering weekly cycles;
- metric and threshold decided before reading.
An A/A test, in which both groups see the same experience, reveals platform issues. It does not guarantee everything, but detects an allocation problem or unstable measurement.
The team also monitors sample ratio mismatches when the observed distribution differs from that expected. Analysing despite this alert amounts to trusting a potentially biased population.
11. Read results without inventing a story
Statistical significance measures neither economic value nor the absence of bias. A tiny effect can become significant with a lot of traffic. A significant effect may remain uncertain on a small segment.
The report presents the absolute and relative effect, the uncertainty interval, the duration, the population, the safeguards and the analyses planned. Post-hoc segment analyses are exploratory. They feed a new test instead of being treated immediately as a conclusion.
Microsoft Research has identified twelve metric-interpretation pitfalls drawing on thousands of tests: mean effects, ratios, novelty effects, unstable metrics and conditional readings, among others. The review process counts as much as the calculation.
The decision can be: deploy, continue, stop, correct instrumentation or launch a targeted test. "Inconclusive" is a valid result.
12. Reporting: one page, three depths
The executive dashboard spans one page. It shows the result, the deviation from the plan, the three most likely causes, the risks and the decisions required. Each indicator displays its freshness date.
The operational level supports segmentation and action: channel, product, cohort, team, region. It retains the definitions.
The diagnostic level exposes events, quality, pipeline, consent and reconciliation. It is used by analysts and engineers when a figure appears wrong.
These levels share the same semantic model. Copying a formula into each tool recreates discrepancies.
Good reporting also includes narrative. "The margin drops by 4 points, mainly because the share of product B has increased; conversion remains stable" helps more than a cloud of curves.
13. Case study: a funnel that appeared to improve
A SaaS company observed an 18% increase in registrations after a redesign. The team plans to increase the media budget. However, confirmed revenue increases by only 3%.
Diagnosis separates layers. The new event starts when the form is opened, while the old one starts after validation. Part of the increase is an instrumentation artefact. Then, the share of mobile users grows and generates more free accounts. Finally, consent modelling estimated a previously unobserved share of traffic.
The tracking plan is fixed.signup_startedandaccount_createdbecome two events. CRM confirmsqualified_account, then billing sendssubscription_paid. The table displays observed and modelled separately.
A controlled test finally shows that the redesign improves the account-creation rate by 6%, but does not yet show a conclusive effect on payment. The decision changes: deploy the usability improvements, maintain budget and improve activation. Measurement did not remove uncertainty. It prevented the team from financing the wrong hypothesis.
14. Governance and operations
The business owner validates the metrics. The analytics manager maintains the dictionary and analyses. Developers implement according to the contract. The DPO and legal counsel frame processing. Marketing configures platforms without circumventing the rules. The data team reconciles with reference systems.
Every site change, CMP, tag manager, SDK, payment domain or ad tool triggers acceptance testing. Dependencies are numerous. A seemingly harmless update can remove a campaign parameter or double a purchase.
The weekly check is as follows: valid event rates, duplicates, arrival time, web/server gap, consented share, modelled share, unallocated revenue and version errors. A quarterly review removes unused events and revalidates the purposes.
15. An eight-week roadmap
Week 1 — Decisions. Select five decisions, their owners, timelines and thresholds.
Week 2 — Metric tree. Set result, levers and safeguards. Reconcile revenue with finance.
Week 3 — Audit. Map tags, SDK, CMP, server feed, CRM and platforms. Identify observed and modelled data.
Weeks 4 and 5 — Instrumentation. Write the plan, implement critical events, deduplicate them and test consent.
Week 6 — Quality. Create automatic controls, alerts and comparisons with business sources.
Week 7 — Reporting. Build the three depths and add the decision narrative.
Week 8 — Rehearsal. Launch an A/A or low-risk experiment, simulate a loss of telemetry and document the response.
The final deliverable is not a dashboard. It is a chain in which a decision can be traced back to the data that supports it.
16. FAQ
16.1. Is GA4 enough to drive the company?
No. It describes some of the web or app behaviours, with conventions and sometimes modelling. CRM, billing, refunds and costs must complete the picture.
16.2. Should we measure everything on the server side?
No. The server confirms business events and improves reliability. The client observes the experience. Both are useful, with deduplication and respect for consent.
16.3. Can audience measurement operate without consent?
Some configurations may benefit from an exemption under the strict conditions specified by the CNIL. It is necessary to check purpose, reuse, transfers, duration and actual configuration. This is not an automatic tool property.
16.4. Which attribution model should you choose?
Choose the model whose convention is understood and stable enough for management. Calibrate it with incrementality tests. No attribution model replaces a genuine counterfactual.
16.5. How many events do you need?
Enough to explain decisions and diagnose breakdowns. Start with the critical path and server results. Hundreds of unmaintained events reduce confidence.
17. What revenue can demonstrate — and what an unreconciled signal cannot
The ultimate measure depends on the business model. For a subscription, recognised revenue, cash collected, expansion, contraction and cancellation do not tell the same story. For a marketplace, gross value, commission and margin must remain distinct. For a lead, the lead does not become revenue before qualification, opportunity, sale and subsequent refund.
A monthly review selects a few customer journeys and follows them from end to end. It compares the customer event, collection, storage, CRM, invoice and accounting. Variances receive a cause: expected delay, definition, technical loss, duplication, change or scope.
When the committee sees an 18% increase in analytics conversions, it must be able to verify that controls are working, cancellations have been removed, the new consent setup has not changed the denominator, no CRM import has duplicated sales and the effect persists in subsequent cohorts; until that chain is examined, the report provides a lead for investigation, not evidence of growth.
Good governance distinguishes two states: “decision-ready” and "in the process of reconciliation". Hiding uncertainty makes reporting cleaner and decisions more fragile.
18. Logiks recommendations
Write the decision cards before the tracking plan. Separate observed facts, assigned credits and modelled volumes. Reconcile each result with a business source, test consent through network requests and make telemetry quality a prerequisite for experimentation. A good measurement system does not always provide a definitive answer; it prevents artificial certainty.
19. Main sources
- Eurostat, data 2025 on enterprise data analysis: https://ec.europa.eu/eurostat/statistics-explained/SEPDF/cache/33473.pdf
- Eurostat, ERP, CRM and BI uses in 2025: https://ec.europa.eu/eurostat/web/products-eurostat-news/w/ddn-20260520-1
- CNIL, audience measurement tools and exemption conditions, 4 July 2025: https://www.cnil.fr/fr/cookies-et-autres-traceurs/regles/cookies-solutions-pour-les-outils-de-mesure-daudience
- CNIL, cookies against Google and Shein: https://cnil.fr/fr/regulation-des-cookies-la-cnil-poursuit-le-plan-daction-initie-en-2019-et-prononce-deux-amendes
- Google Analytics, update of data checks as of June 15, 2026: https://support.google.com/analytics/answer/17016975?hl=en
- Google Analytics, Consent mode and behavioural modelling: https://support.google.com/analytics/answer/11161109?hl=fr
- Microsoft Research, Top Challenges from the first Practical Online Controlled Experiments Summit: https://www.microsoft.com/en-us/research/publication/top-challenges-from-the-first-practical-online-controlled-experiments-summit/
- Microsoft Research, Trustworthy Experimentation Under Telemetry Loss: https://www.microsoft.com/en-us/research/publication/trustworthy-experimentation-under-telemetry-loss/
- Microsoft Research, A Dirty Dozen: Twelve Common Metric Interpretation Pitfalls: https://www.microsoft.com/en-us/research/publication/a-dirty-dozen-twelve-common-metric-interpretation-pitfalls-in-online-controlled-experiments/