

Two companies can announce "200 Ai users". In the first, teams reformulate unmeasured emails. In the second, fifty employees reduce the processing time by 30%, with a test set, privacy rules and a product owner.
The scoring framework favours the first. Reproducible capacity favours the second.
The audit is used to distinguish between curiosity, use, capacity and advantage. It does not seek to sanction experimentation. It indicates where the organisation can accelerate, where it must secure and what investments would be premature.
1. Figures that warrant a rigorous diagnosis
Eurostat estimates that 20% of European Union enterprises of at least ten people used AI technology in 2025, compared with 13.5% in 2024. Use varied considerably by size: 17% in small enterprises, 30.36% in medium-sized enterprises and 55.03% in large enterprises.
In France, INSEE found that 10% of companies used AI in 2024: 9% of small, 15% of medium-sized and 33% of large enterprises. Among companies using AI, 69% relied on commercially available software. The audit must therefore examine control over suppliers as closely as internal development.
The French Barometer Num 2025 shows a higher rate in the TPE-SME respondents: 26% reported the use of AI, of which 22% for general AI, 14% for chatbots, 6% for documents, 5% for automation and 5% for data analysis. The scopes and methodologies differ from those of Eurostat; the figures should not be merged. Their contrast shows precisely why an audit should define what it calls "use AI".
A NBER study of 5,179 support agents found an average productivity increase of 14%, reaching 34% among novice or less performing workers. A Harvard Business School experiment with Boston Consulting Group of 758 consultants measured over 25% speed and more than 40% quality for tasks within the capacity boundary study. The audit must therefore measure tasks, not extrapolate an overall gain.
Finally, the ILO estimates in 2025 that one in four jobs in the world is potentially exposed to general AI, and 34% in high-income countries. The organisation speaks more about job transformation than of uniform replacement. Maturity includes the ability to redraw work and accompany people.
2. What the audit must decide
Prior to interviews, the sponsor formulates the expected decisions.
- Do we need to create a common AI platform?
- What three cases of use should be financed in the next semester?
- Which tools should be replaced without control?
- Can the organisation deploy agents with writing?
- What skills are missing?
- What data are preventing industrialisation?
- What governance should be put in place before August 2026?
Without decisions, the audit produces a panorama and a note. With them, it becomes an allocation instrument.
The scope specifies the countries, entities, business functions, tools, applications and suppliers covered. Reviewing headquarters does not automatically represent branch operations. Informal uses must be sought explicitly.
3. The eight-axis maturity matrix
Logiks evaluates eight axes, each on five levels. The overall score is less important than the profile: excellent technology with weak governance is an imbalance, not a high maturity.
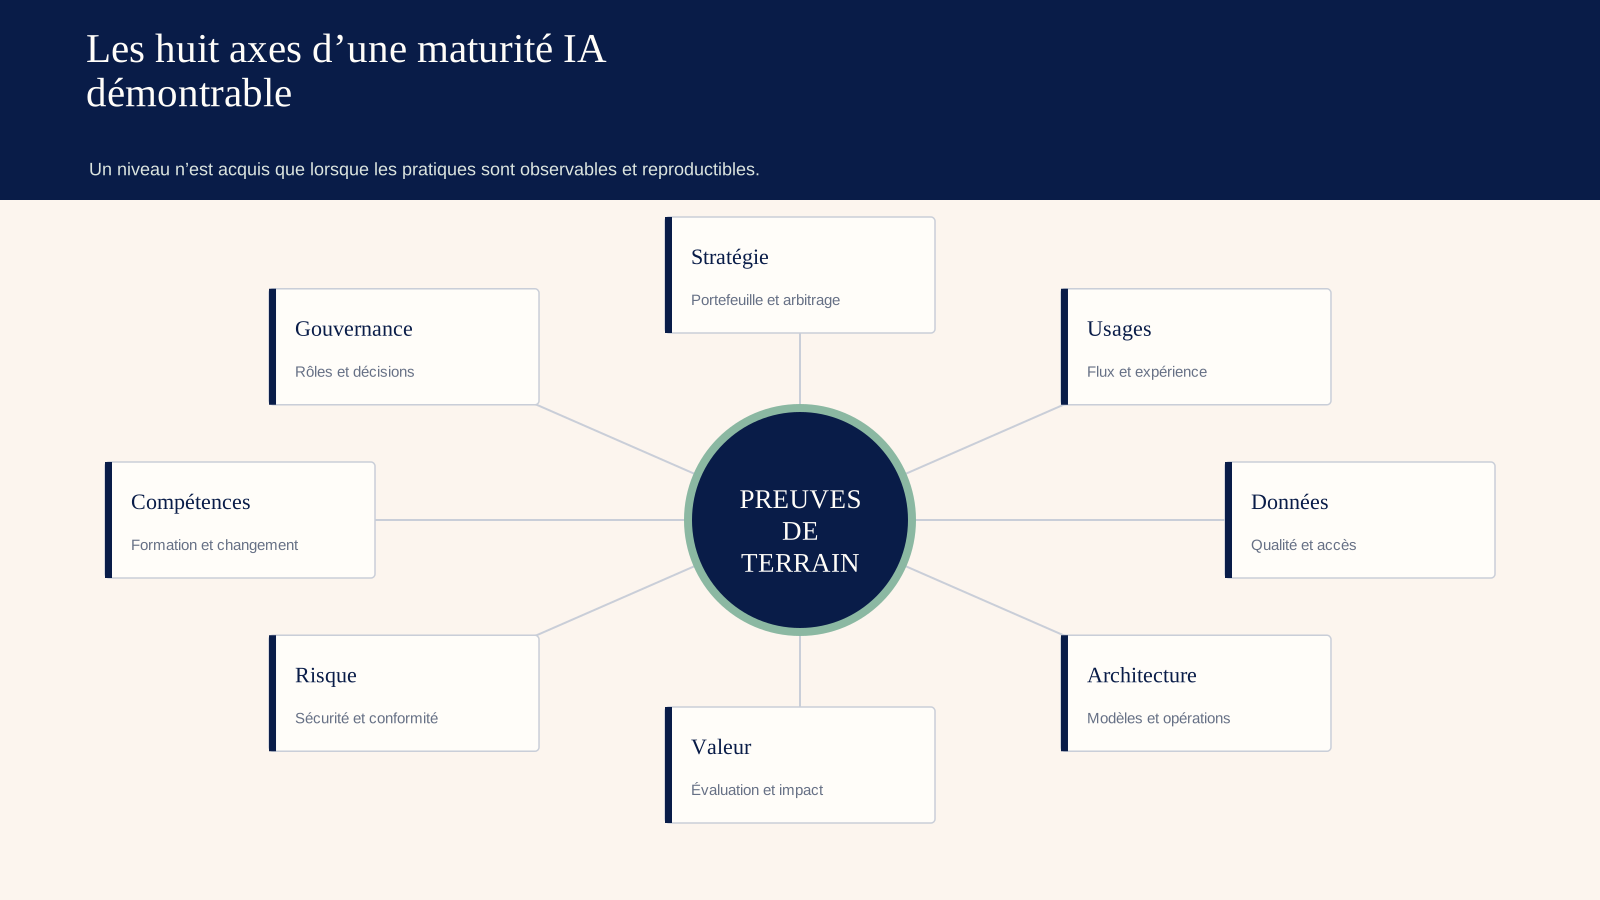
3.1. Axis 1 — Strategy and portfolio
Level 1, opportunistic. Projects come from isolated initiatives. No result or owner is defined.
Level 2, exploratory. A list of cases exists, mainly guided by feasibility or visibility.
Level 3, prioritised. Use cases are compared by value, risk, data readiness, time to value and adoption. Go/stop criteria are used.
Level 4, piloted. The portfolio balance fast gains, common assets and strategic bets. Profits are tracked.
Level 5, adaptive. The company regularly reallocates according to evidence, model changes and strategy.
Evidence: investment theses, backlog, business cases, judgment decisions, budget and results.
3.2. Axis 2 — Use cases and user experience
The first level corresponds to generic tools without processes. The second represents voluntary pilots. The third to integrated flows, with human control and support. The fourth measures adoption, corrections and effects. The fifth continually recomposes the work around human and machine capabilities.
Evidence: process maps, route, active usage rate, completed tasks, feedback and time saved observed.
A licence assigned does not constitute adoption. A monthly login is not an adoption. The audit asks what changes in the decision.
3.3. Axis 3 — Data and knowledge
Level 1. Dispersed documents, unknown rights, conflicting definitions.
Level 2. Pilot body and manual cleaning.
Level 3. source versions, owners, quality, metadata and access.
Level 4. Data products, line, continuous evaluation and correction loops.
Level 5. knowledge assets differentiating, reusable and governed at scale.
Evidence: catalogue, data contracts, freshness rate, golden sets, provenance and deletion procedures.
3.4. Axis 4 — Models, architecture and operations
Maturity progresses from untracked direct calls to a gateway, a registry, evaluations, routing, progressive deployments, OLSs and tested reversibility. Level 5 does not mean "all build"; it means being able to replace a component without losing the system.
Evidence: diagrams, model log, quick versions, tracks, task cost, fallback and migration exercise.
3.5. Axis 5 — Evaluation and value
At the first stage, quality is judged by a few demos. The second leads the team to note selected examples. From the third stage, a representative test set, thresholds and a baseline exist. The fourth link the trade metrics to the impact experiences. At the most advanced stage, the organisation manages a portfolio of evaluations, including adversarial and segment-based evaluations.
Evidence: masked datasets, results by version, cost matrices, control groups, critical errors and net benefits.
3.6. Axis 6 — Security, compliance and ethics
The first stage is based on informal instructions. The second stage sets up a list of tools and a charter. At the third stage, an inventory ranks the risks and limits given and permissions. Level 4 tests attacks, monitors incidents and forms evidence files. Level 5 integrates safety and compliance into pipelines and contracts.
Evidence: registry, GDPR analysis, AI Act qualification, red team, access, incidents and supplier clauses.
3.7. Axis 7 — Skills and change
The progression ranges from generic training to role paths, champions, learning time, a reshaping of objectives and a measure of applied competence.A mature organisation also knows how to accompany occupations whose tasks change.
Evidence: competency mapping, exercises, communities, support, correction rates and confidence surveys.
The OECD notes that, in the data studied for several countries, less than 30% of SMEs had offered AI-related training, with 11.3% in Japan and 29.4% in Canada.
3.8. Axis 8 — Governance and accountability
At the first level, no one can stop a system. At the second level, a sponsor and a committee exist. At level 3, the roles, thresholds and exceptions are dated. At level 4, the committee receives indicators of value and risk. At level 5, governance is distributed, tooled and audited.
Evidence: decisions, RACI, owners, dashboard, reviews and cessation procedures.
4. Scoring method: avoid self-declared maturity
Each axis receives a score of 1 to 5 only if the level criteria are demonstrated. A presentation is not evidence of operational use. A written process but not used receives the lower level.
The audit samples at least three contrasting cases: an individual assistant, an integrated workflow and the most risky case. For each, it follows a real request: identity, data, model, result, action, trace and correction.
The score is weighted according to the strategy. A bank gives more weight to risk and traceability. A creative agency can favour portfolio, adoption and ownership of content, without neglecting confidentiality.
A cap rule avoids inconsistencies. For example, if no system inventory exists, governance cannot exceed level 2. If no evaluation dataset exists, the model axis cannot be considered production-ready.
The report shows confidence in the score: strong, medium or low depending on the coverage of the evidence. A precise note to the tenth with few interviews gives a false objectivity.
5. Field work
5.1. Document review
The team asks for strategy, budgets, contracts, architecture, inventories, evaluations, procedures, training materials, incidents and dashboards. The absence of a document is information, not automatically a fault.
5.2. Interviews
Interviews cover management, business teams, IT leadership, data, security, the DPO, HR, procurement and users. They start from an event: "Show the last time the system was wrong."This question reveals more than "Do you trust?"
5.3. Observation
The auditor observes a user completing the task with and without the tool. They record checks, copy-and-paste steps, workarounds and waiting times. Actual use often differs from the documented procedure.
5.4. Tests
According to the authorisation, the audit tests known cases, ambiguous data, rights, removal, supplier unavailability and controlled attacks. A maturity audit is not a complete penetration test, but it verifies that controls exist.
5.5. Economic analysis
The costs cover licences, integration, data, supervision, training and recovery. Gains are reduced to a task or decision. The "saved" time is counted only if it is reused or improves a result.
6. Example scorecard
An ITE has the following profile: strategy 3, uses 2, data 2, architecture 3, evaluation 1, risks 2, skills 2, governance 2.
The simple average is 2.1. It does not say what to do. The diagnosis shows instead a correct platform supporting poorly evaluated, weakly adopted use cases. Adding a more powerful model would not correct anything.
Three decisions emerged:
- freeze new pilots for six weeks;
- build an evaluation dataset for two existing workflows;
- create a knowledge product with owner and rights.
The fourth site trains managers to redraw tasks. The committee only finances a new agent after demonstrating quality and control over an existing case.
7. Identify the four debts
The audit classifies the differences into four debts.
Debt of value. Case without decision, baseline or demonstrated benefit.
Data debt. Unowned sources, weak labels, blurred rights or obsolete knowledge.
Operating debt. Prototypes without versions, monitoring, cost assigned nor fallback.
Trusted debt. Unknown risks, untrained users, hidden incidents or inexplicable decisions.
Each debt has an estimated amount or exposure, an owner and a share. This reading avoids a road map only technical.
8. Prioritise with a value–readiness–risk matrix
Each case receives three separate notes.
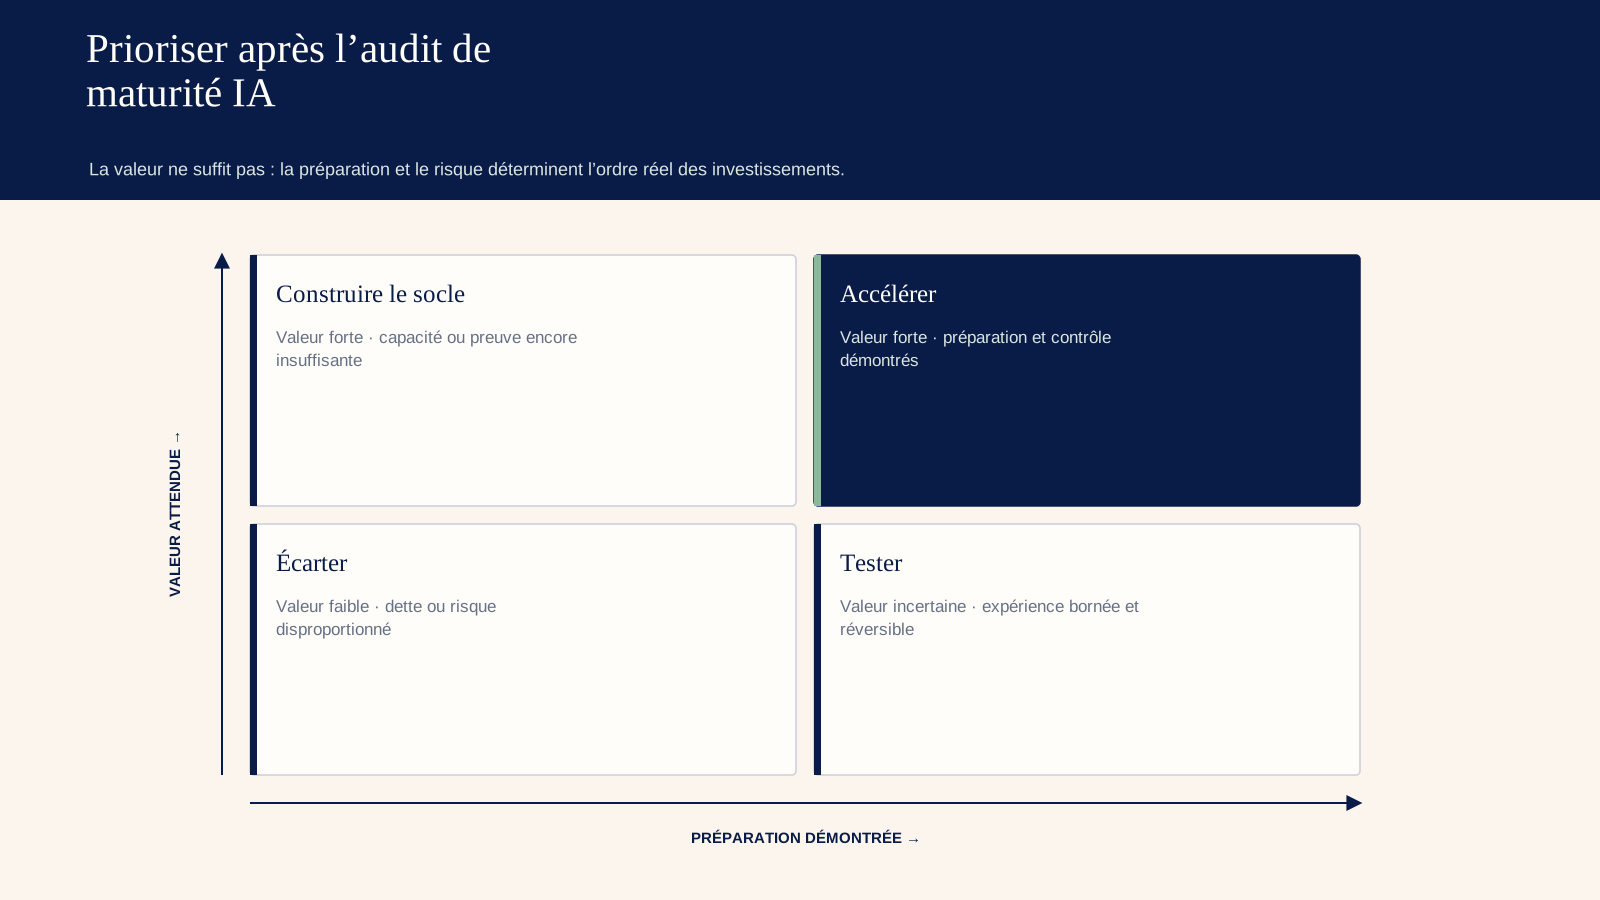
The value estimates volume, unit gain, differentiation and urgency. The preparation covers data, process, sponsor, integration and competence. The risk covers impact on people, autonomy, sensitivity and reversibility.
The combination of high value–high preparation becomes a priority pilot. A case of high value but low data becomes a background site. A case of high risk and low value is stopped. A simple case of modest value can be used to learn if it creates a common component.
The matrix displays dependencies. A commercial assistant, a support response engine and a legal tool can all depend on the same client corpus. Build this base passes before three interfaces.
9. False evidence of maturity
- number of accounts provided;
- volume of tokens consumed;
- participation in training without exercise;
- impressive prototype of ten examples;
- charter without technical inspection;
- Committee without decision of judgment;
- ROI calculated only from declared minutes;
- proprietary model without exportable data assets;
- satisfaction rate without error measurement;
- absence of incident in an unattended system.
These signals can complete the diagnosis. None is enough.
10. Deliverables expected
A useful audit provides:
- Qualified inventory of uses and systems;
- scorecard with evidence, limits and confidence;
- risk and debt card;
- prioritised portfolio with go/stop criteria;
- minimum target architecture;
- skills plan by role;
- road map at 30, 90 and 365 days;
- indicators and owners;
- list of executive decisions to be taken.
Each recommendation indicates effort, impact, dependency and evidence of success. "Setting up governance" becomes, for example, "name the owners of the fifteen systems, classify their risks and obtain a shutdown procedure tested within 60 days".
11. When will the audit be repeated?
A slight review can be quarterly. The full audit is restarted after twelve to eighteen months, a significant change in regulation, an acquisition, an incident or the transition to autonomous agents.
The scores must not increase mechanically. The requirement progresses with impact. A team that moves from an assistant to a decision-making system may see its apparent maturity decline because the required level of control increases.
Monitoring measures evidence: inventory systems, recent assessments, validated value, incidents, applied training and exit exercises.
12. Frequently Asked Questions
12.1. How long does an AI maturity audit take?
Between four and eight weeks for an average organisation, depending on the number of entities and cases. An express diagnosis may prioritise, but it should not claim to cover informal uses and in-depth controls.
12.2. Should we wait for a lot of projects?
No. A small audit before first deployments avoids fragmentation. With few cases, it focuses more on strategy, data, suppliers and safeguards.
12.3. Who should sponsor it?
A senior leader able to balance business needs, technology, risk and resources. IT alone cannot decide value; the business function alone cannot carry architecture and compliance.
12.4. Does compliance with the AI Act give a good score?
It contributes to the risk axis. Maturity also covers value, adoption, data and operations. A documented but unnecessary system remains immature economically.
12.5. Can we compare ourselves to other companies?
With caution. Size, sector, risk and strategy change the requirement. The best comparison follows the progress of internal evidence and the capabilities required for objectives.
13. From the declared level and axis to what the company can actually reproduce
The readout must show a capacity in action. For each axis, the auditor selects a use case and asks for a demonstration: a team formulates the objective, retrieves the authorised data, performs the evaluation, handles a failure, explains the supervision and calculates a result. The absence of evidence does not automatically mean absence of work; it limits the degree of assurance.
Three columns protect the decision. Designed indicates that a policy, architecture or process exists. Deployment shows the share of teams and cases covered. Staffing verifies that the controls and uses produce the expected result. An organisation can be advanced in design and fragile in operation.
The final score does not average blindly. A safety at 1/5 does not disappear behind five axes at 4/5. Floors are applied for sensitive uses, and uncertainty appears separately. When the evidence diverges according to the subsidiaries, the report presents the distribution rather than a false group figure.
The roadmap then links each capacity to a priority case. For example, instead of "building an Ai platform", it specifies: logging 100% of the support co-pilot's calls, building 300 cases of appraisal with business owners, testing the reverse, reducing the unjustified responses on this corpus by 40% and extending traffic only after four weeks below the safety, quality and human load thresholds; this granularity turns an abstract level into a financial learning sequence.
The three- or six-month review retests the closed elements. It distinguishes deliverable produced, behaviour adopted and business result. If use remains low, the problem can come from the workflow, trust, management or unhelpful proposal; buying more licences does not solve any of these diagnoses.
Finally, the target maturity depends on the portfolio. An SME that automates three stable processes does not need the same device as a publisher who exposes models to thousands of customers. The report recommends the necessary level, not the theoretical maximum.
The decision file retains the conflicting evidence and areas not covered, and explains why they do not immediately change the priority, so that a new sensitive case, acquisition, supplier incident or regulatory evolution can quickly reopen the diagnosis without repeating the interviews and inventories from the beginning.
14. What Logiks recommends
Audit three real use cases end to end and demand proof for each level. Keep the eight separate axes, then prioritise according to value, readiness and risk. The right result is not a flattering score: it is a clear decision on what to speed up, repair or stop.
15. Main sources
- Eurostat, use of AI in enterprises in 2025: https://ec.europa.eu/eurostat/web/products-eurostat-news/w/ddn-20251211-2
- Insee, Use of artificial intelligence by enterprises in 2024 : https://www.insee.fr/fr/statistiques/8616837
- France Num, Barometer France Num 2025 : https://www.francenum.gouv.fr/guides-et-conseils/strategie-numerique/comprendre-le-numerique/barometre-france-num-2025-le
- NBER, Brynjolfsson, Li and Raymond, study with 5,179 officers: https://www.nber.org/papers/w31161
- Harvard Business School, BCG study with 758 consultants: https://aiinstitute.hbs.edu/navigating-the-jagged-technological-frontier/
- ILO, Global Index 2025 of General AI Exposure: https://www.ilo.org/resource/news/one-four-jobs-risk-being-transformed-genai-new-ilo%E2%80%93nask-global-index-shows
- OECD, AI adoption by small and medium-sized enterprises : https://www.oecd.org/content/dam/oecd/en/publications/reports/2025/12/ai-adoption-by-small-and-medium-sized-enterprises_9c48eae6/426399c1-en.pdf
- NIST, AI Risk Management Framework : https://airc.nist.gov/airmf-resources/airmf/5-sec-core/